The number of very hot days has significantly decreased in Louisiana compared to the first half of the twentieth century. Even amidst modest overall warming, only nighttime temperatures have seen any increase.
There has been a modest increase in precipitation, and a decrease in drought.
The number and intensity of hurricanes striking Louisiana’s coastline has not worsened.
Production of iconic Louisiana agricultural products like crawfish and sugarcane has increased.
Short Summary:
Temperature Trends:
Louisiana has warmed only 0.5°F since the start of the twentieth century, much less than the average rate for the rest of the country, which is about 1.8°F.1
The number of days classified as “very hot” (maximum temperatures 95°F or higher) are fewer today than when records for Louisiana began at the beginning of the last century. Although average temperatures in the state have slightly increased over the past hundred-plus years, it is nighttime temperatures where most of the warming has occurred. The number of nights where the low temperature was 75°F or higher has gradually increased. This is notable because nighttime temperature measurements are often heavily influenced by the urban heat effect. Local heat sources associated with urbanization like concrete, brick, steel, vehicles, air conditioning and heating units, and other machinery, contribute to an increase in local nighttime temperatures.2
The number of freezing days in recent decades is consistent with those seen at the beginning of the twentieth century.3
Precipitation:
Louisiana has seen a gradual increase in precipitation since 1900.4
Data show drought has not gotten more frequent or severe in Louisiana from 1895 to 2023. In fact, long-term data show the worst droughts in Louisiana occurred in the late 1800s and early twentieth century.5
Hurricanes:
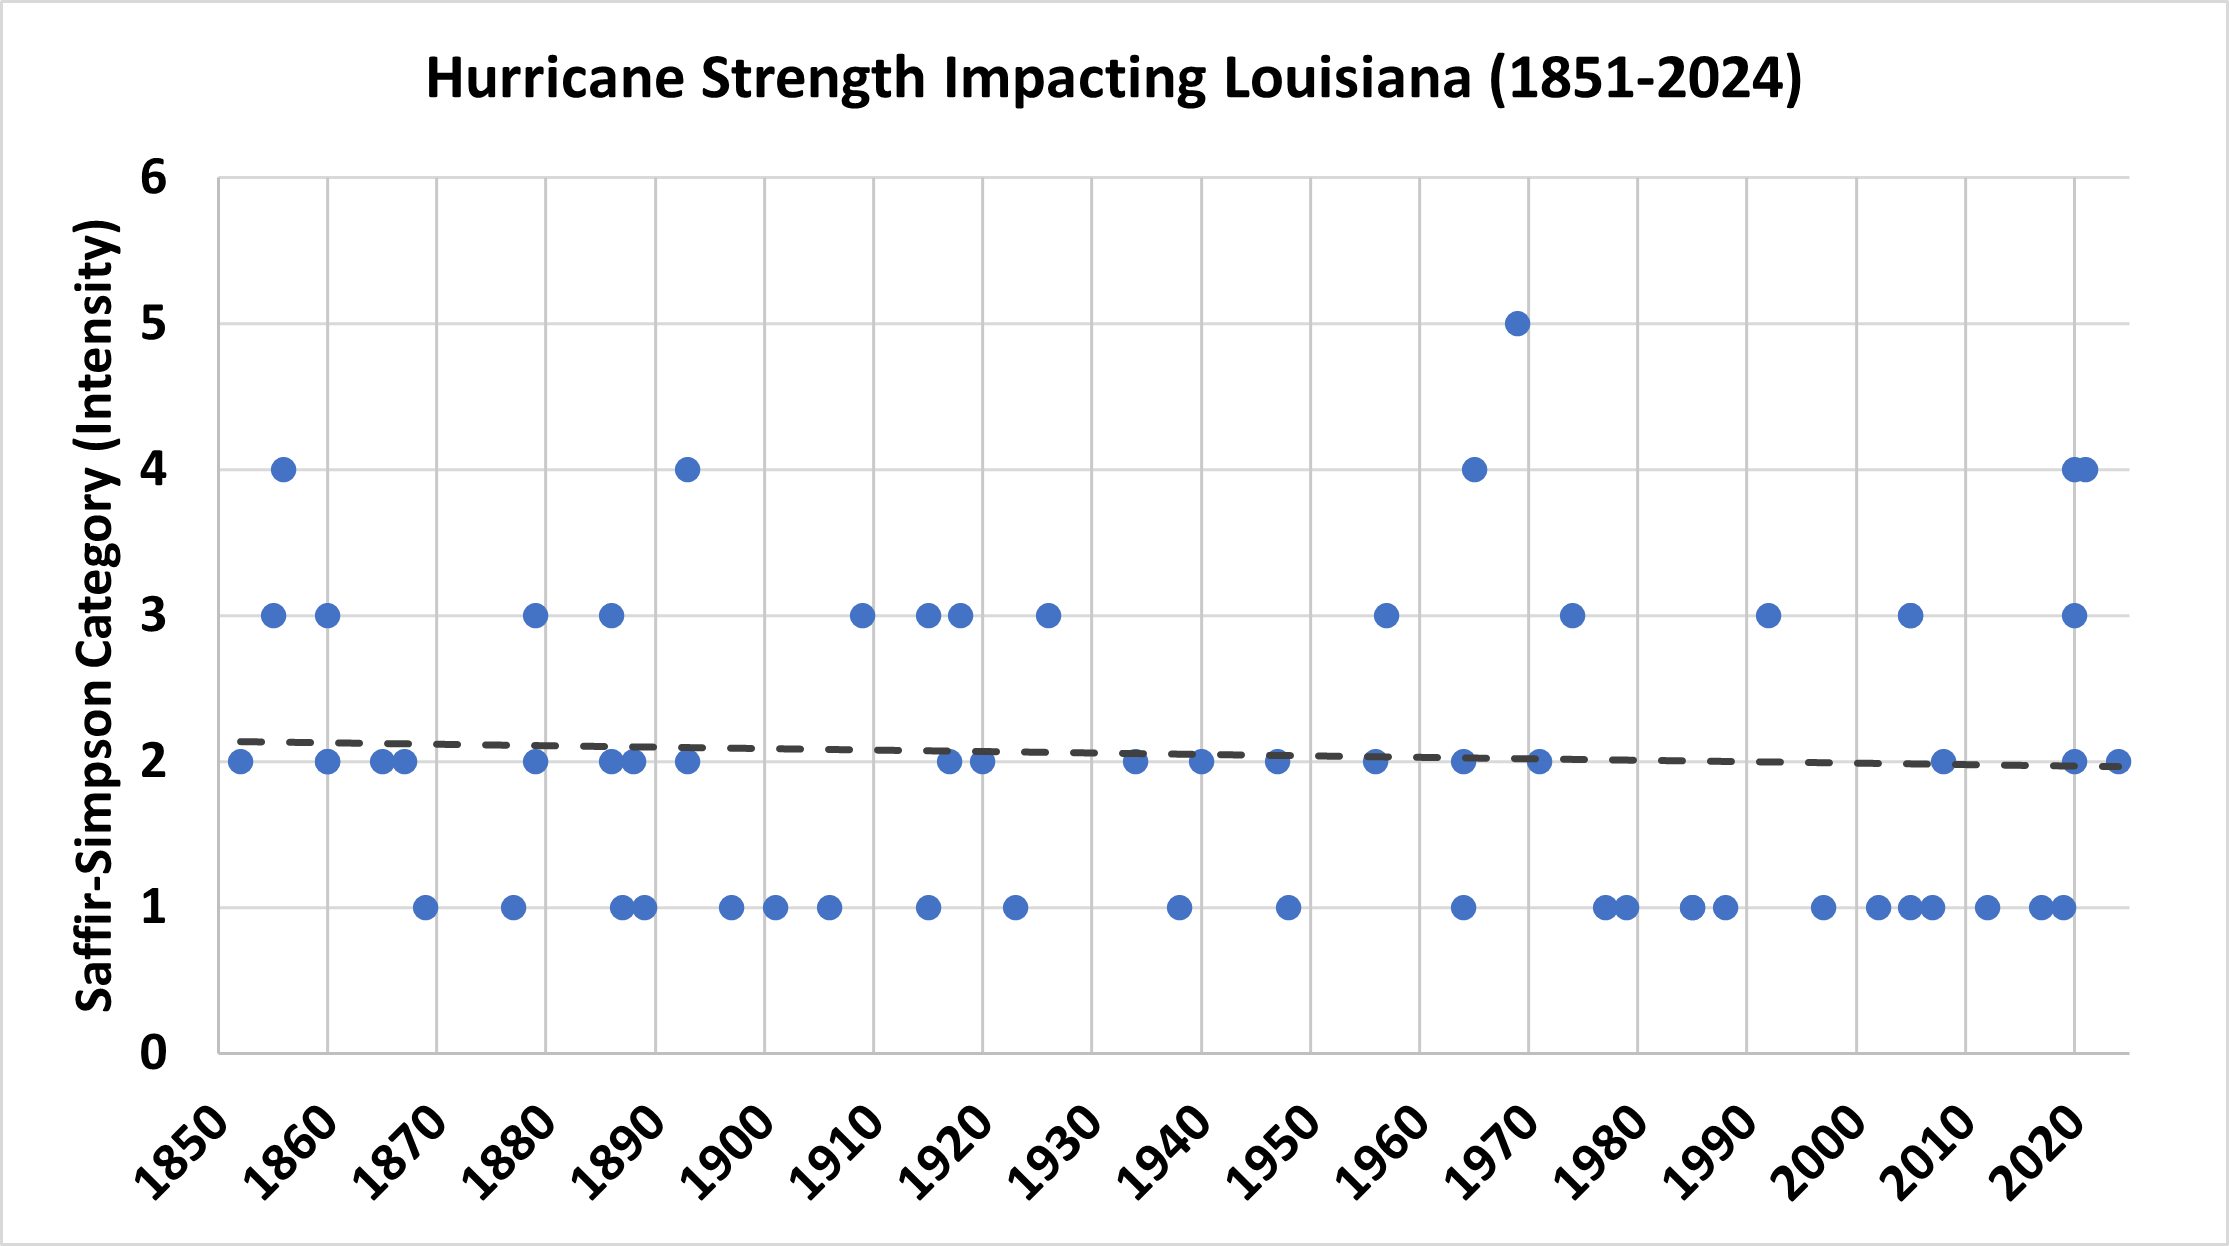
One of the most powerful and dangerous types of extreme weather events that impact Louisianians are hurricanes and tropical storms. Despite some claims to the contrary, hurricanes have not caused greater harm or occurred more frequently in Louisiana in recent years. Louisiana hurricane data show that no trend of increasing hurricane impact or strength exists from the mid-nineteenth century to today, and there may be a slight decline in both metrics.6,7
Figure 1: Number of hurricanes per decade from 1851-2020. Dashed line for linear trend. Chart by Dr. Roy Spencer from data published by National Hurricane Center’s HURDAT database.
Figure 2: Saffir-Simpson Category (Intensity) of hurricanes hitting Louisiana from 1851-2024. Data from the National Hurricane Center’s HURDAT database, as summarized on Wikipedia.8 Dashed line is the linear trend.
Sea Level Rise:
Rising seas are another environmental challenge for Louisiana. That is because low-lying South Louisiana is prone to land subsidence and erosion due to natural coastal effects, human development, and the construction of channels for transportation in rivers and bayous. These combined factors give Louisiana the highest rate of relative sea level rise in the country, and they swamp any sea level rise possibly attributable to climate change. Indeed, actual “sea level rise” is not that extreme.9
Agriculture:
Some of Louisiana’s most iconic agricultural products are crawfish, sugarcane, and rice.
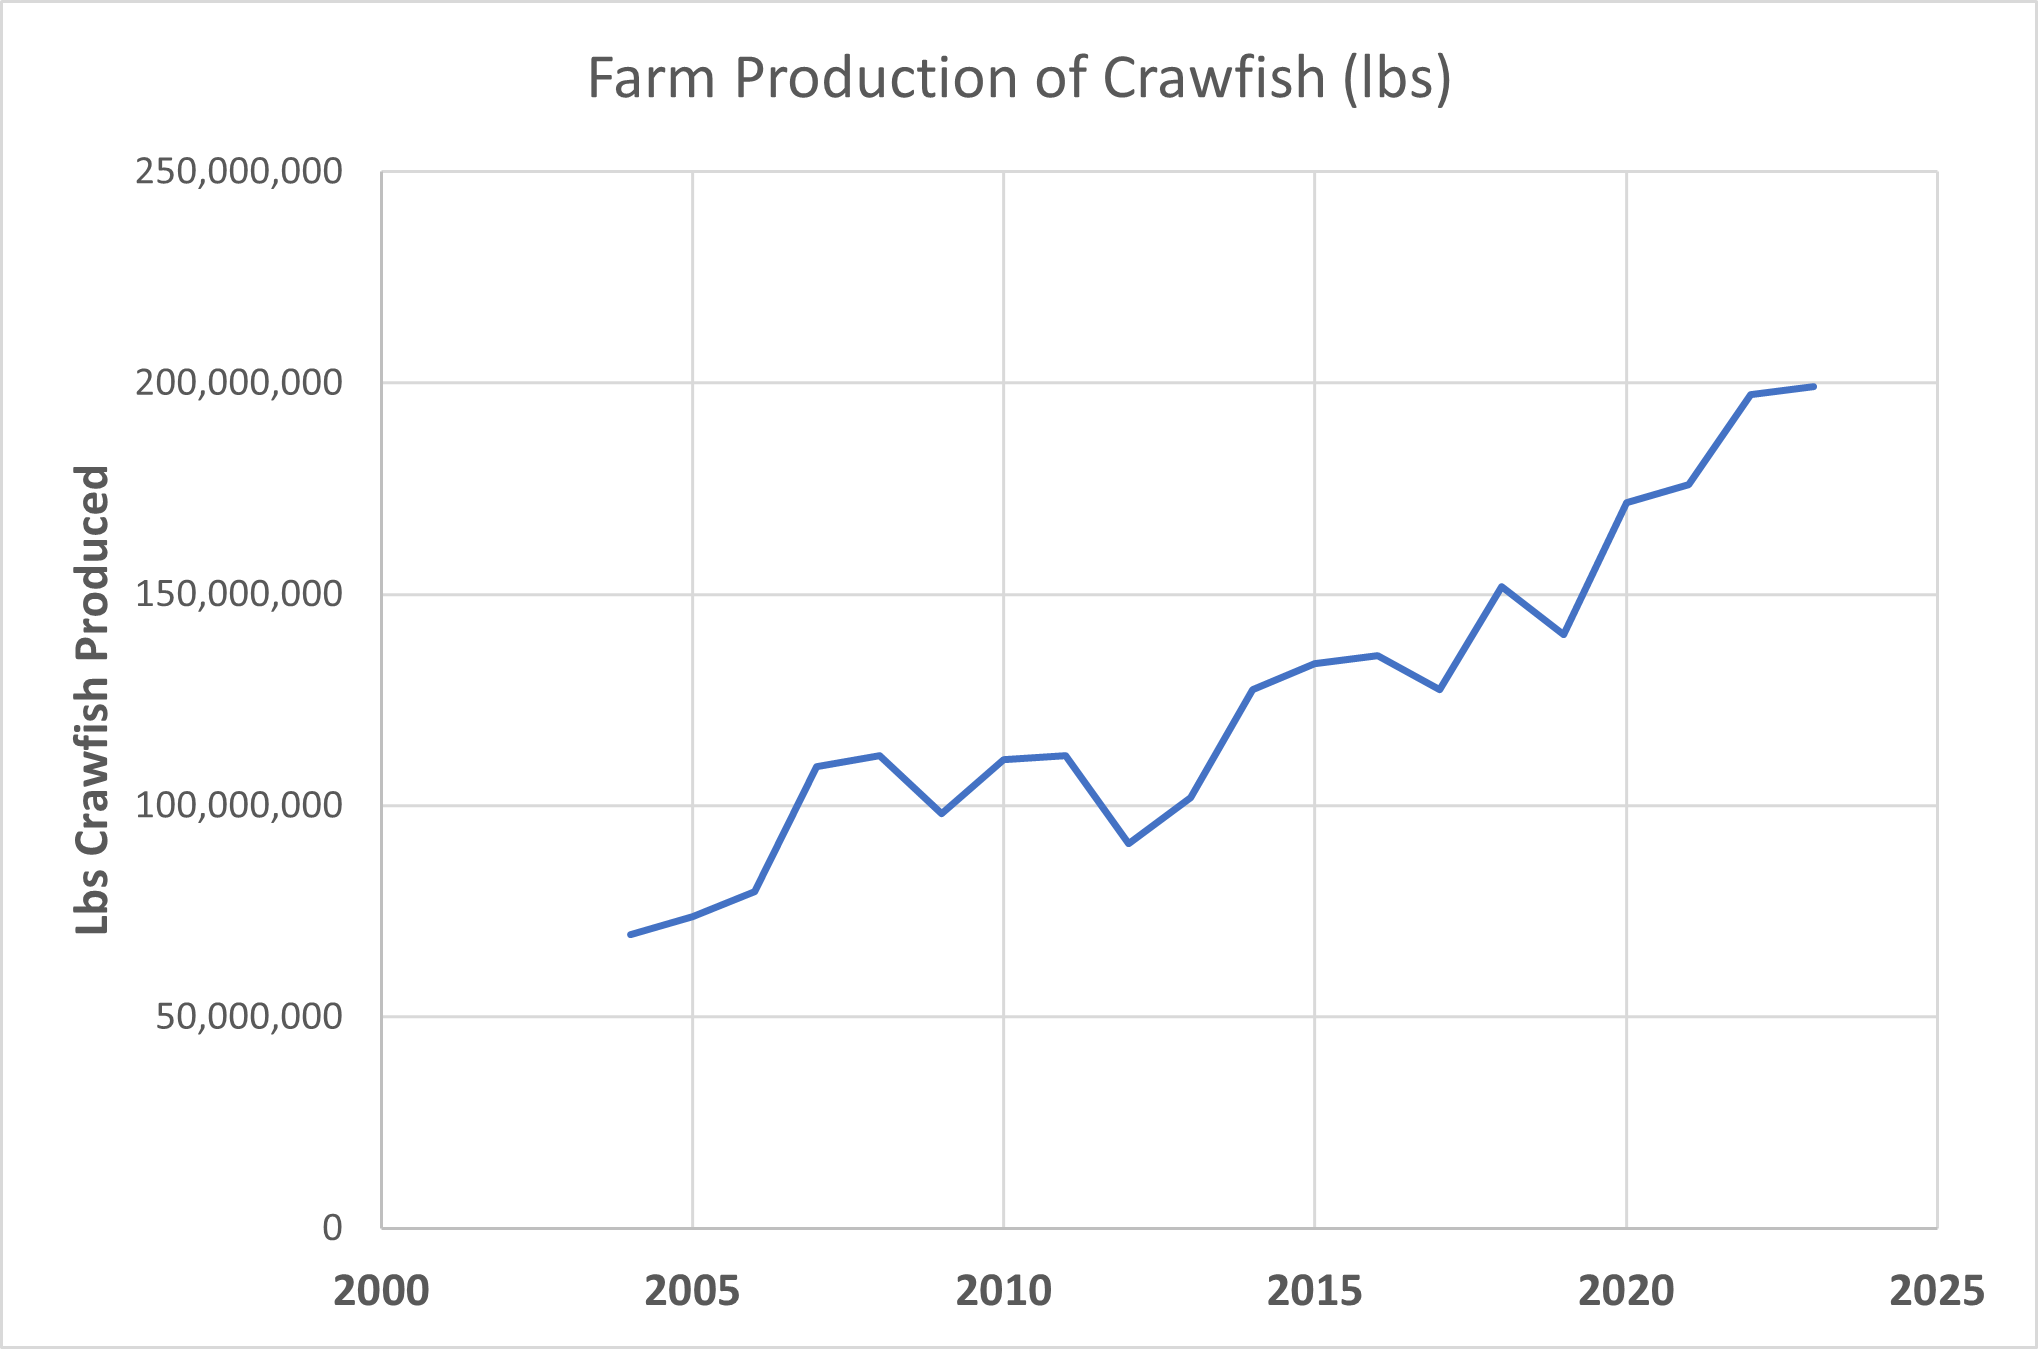
Crawfish production has steadily increased over the past few decades according to data from the yearly Summary of Agriculture and Natural Resources published by the Louisiana State University Ag Center.10
Figure 3: Production of farmed crawfish (tons) in Louisiana from 2004 to 2023. Data from Louisiana State University Ag Center’s yearly Summary of Agriculture and Natural Resources, https://www.lsuagcenter.com/~/media/system/6/2/2/f/622fd220ad73e4178c07efd517b58964/p2382%202023%20ag%20summarypdf.pdf.
Sugarcane production (in pounds of sugar) has seen an incredible increase of 273 percent since just 1990, according to USDA data, and rice production (in pounds) has increased by 16 percent over the same period.11
Figure 4: Sugar from sugarcane (tons) in Louisiana from 1990 to 2024. Data from U.S. Department of Agriculture USDA/NASS QuickStats. https://quickstats.nass.usda.gov/results/C30F9FEA-2D0C-37A5-9C1E-FCCA6AF4E724.
Conclusion:
Based on the available data, there is no evidence that climate change is harming Louisiana by causing dramatic increases in temperatures or making weather worse there. Climate change may, in fact, be benefiting the state, by contributing to an increase in agricultural production.
Frankson, R., K.E. Kunkel, S.M. Champion, and, J. Nielsen-Gammon, 2022: Louisiana State Climate Summary 2022. NOAA Technical Report NESDIS 150-LA. NOAA/NESDIS, Silver Spring, MD, 6 pp.
Frankson, R., K.E. Kunkel, S.M. Champion, and, J. Nielsen-Gammon, 2022: Louisiana State Climate Summary 2022. NOAA Technical Report NESDIS 150-LA. NOAA/NESDIS, Silver Spring, MD, 6 pp.
Spencer, R. (2020, August 26). Even with Laura, Louisiana Hurricanes Have Not Increased Since 1851. Roy Spencer PhD Blog. https://www.drroyspencer.com/2020/08/even-with-laura-louisiana-hurricanes-have-not-increased-since-1851/
National Oceanic and Atmospheric Administration. (n.d.). Sea level trends – NOAA tides & currents. Tides & Currents. https://tidesandcurrents.noaa.gov/sltrends/sltrends.html
Guidry, K., & Blanchard, T. M. (2024). (tech.). 2022 Louisiana Summary: Agriculture & Natural Resources. LSU AgCenter. Retrieved March 17, 2025, from https://www.lsuagcenter.com/~/media/system/6/2/2/f/622fd220ad73e4178c07efd517b58964/p2382%202023%20ag%20summarypdf.pdf.
The number of very hot days has significantly decreased in Louisiana compared to the first half of the twentieth century. Even amidst modest overall warming, only nighttime temperatures have seen any increase.
There has been a modest increase in precipitation, and a decrease in drought.
The number and intensity of hurricanes striking Louisiana’s coastline has not worsened.
Production of iconic Louisiana agricultural products like crawfish and sugarcane has increased.
Short Summary:
Temperature Trends:
Louisiana has warmed only 0.5°F since the start of the twentieth century, much less than the average rate for the rest of the country, which is about 1.8°F.1
The number of days classified as “very hot” (maximum temperatures 95°F or higher) are fewer today than when records for Louisiana began at the beginning of the last century. Although average temperatures in the state have slightly increased over the past hundred-plus years, it is nighttime temperatures where most of the warming has occurred. The number of nights where the low temperature was 75°F or higher has gradually increased. This is notable because nighttime temperature measurements are often heavily influenced by the urban heat effect. Local heat sources associated with urbanization like concrete, brick, steel, vehicles, air conditioning and heating units, and other machinery, contribute to an increase in local nighttime temperatures.2
The number of freezing days in recent decades is consistent with those seen at the beginning of the twentieth century.3
Precipitation:
Louisiana has seen a gradual increase in precipitation since 1900.4
Data show drought has not gotten more frequent or severe in Louisiana from 1895 to 2023. In fact, long-term data show the worst droughts in Louisiana occurred in the late 1800s and early twentieth century.5
Hurricanes:
One of the most powerful and dangerous types of extreme weather events that impact Louisianians are hurricanes and tropical storms. Despite some claims to the contrary, hurricanes have not caused greater harm or occurred more frequently in Louisiana in recent years. Louisiana hurricane data show that no trend of increasing hurricane impact or strength exists from the mid-nineteenth century to today, and there may be a slight decline in both metrics.6,7
Figure 1: Number of hurricanes per decade from 1851-2020. Dashed line for linear trend. Chart by Dr. Roy Spencer from data published by National Hurricane Center’s HURDAT database.
Figure 2: Saffir-Simpson Category (Intensity) of hurricanes hitting Louisiana from 1851-2024. Data from the National Hurricane Center’s HURDAT database, as summarized on Wikipedia.8 Dashed line is the linear trend.
Sea Level Rise:
Rising seas are another environmental challenge for Louisiana. That is because low-lying South Louisiana is prone to land subsidence and erosion due to natural coastal effects, human development, and the construction of channels for transportation in rivers and bayous. These combined factors give Louisiana the highest rate of relative sea level rise in the country, and they swamp any sea level rise possibly attributable to climate change. Indeed, actual “sea level rise” is not that extreme.9
Agriculture:
Some of Louisiana’s most iconic agricultural products are crawfish, sugarcane, and rice.
Crawfish production has steadily increased over the past few decades according to data from the yearly Summary of Agriculture and Natural Resources published by the Louisiana State University Ag Center.10
Figure 3: Production of farmed crawfish (tons) in Louisiana from 2004 to 2023. Data from Louisiana State University Ag Center’s yearly Summary of Agriculture and Natural Resources, https://www.lsuagcenter.com/~/media/system/6/2/2/f/622fd220ad73e4178c07efd517b58964/p2382%202023%20ag%20summarypdf.pdf.
Sugarcane production (in pounds of sugar) has seen an incredible increase of 273 percent since just 1990, according to USDA data, and rice production (in pounds) has increased by 16 percent over the same period.11
Figure 4: Sugar from sugarcane (tons) in Louisiana from 1990 to 2024. Data from U.S. Department of Agriculture USDA/NASS QuickStats. https://quickstats.nass.usda.gov/results/C30F9FEA-2D0C-37A5-9C1E-FCCA6AF4E724.
Conclusion:
Based on the available data, there is no evidence that climate change is harming Louisiana by causing dramatic increases in temperatures or making weather worse there. Climate change may, in fact, be benefiting the state, by contributing to an increase in agricultural production.
Frankson, R., K.E. Kunkel, S.M. Champion, and, J. Nielsen-Gammon, 2022: Louisiana State Climate Summary 2022. NOAA Technical Report NESDIS 150-LA. NOAA/NESDIS, Silver Spring, MD, 6 pp.
Frankson, R., K.E. Kunkel, S.M. Champion, and, J. Nielsen-Gammon, 2022: Louisiana State Climate Summary 2022. NOAA Technical Report NESDIS 150-LA. NOAA/NESDIS, Silver Spring, MD, 6 pp.
Spencer, R. (2020, August 26). Even with Laura, Louisiana Hurricanes Have Not Increased Since 1851. Roy Spencer PhD Blog. https://www.drroyspencer.com/2020/08/even-with-laura-louisiana-hurricanes-have-not-increased-since-1851/
National Oceanic and Atmospheric Administration. (n.d.). Sea level trends – NOAA tides & currents. Tides & Currents. https://tidesandcurrents.noaa.gov/sltrends/sltrends.html
Guidry, K., & Blanchard, T. M. (2024). (tech.). 2022 Louisiana Summary: Agriculture & Natural Resources. LSU AgCenter. Retrieved March 17, 2025, from https://www.lsuagcenter.com/~/media/system/6/2/2/f/622fd220ad73e4178c07efd517b58964/p2382%202023%20ag%20summarypdf.pdf.
We use cookies to ensure that we give you the best experience on our website. If you continue to use this site we will assume that you are happy with it.