
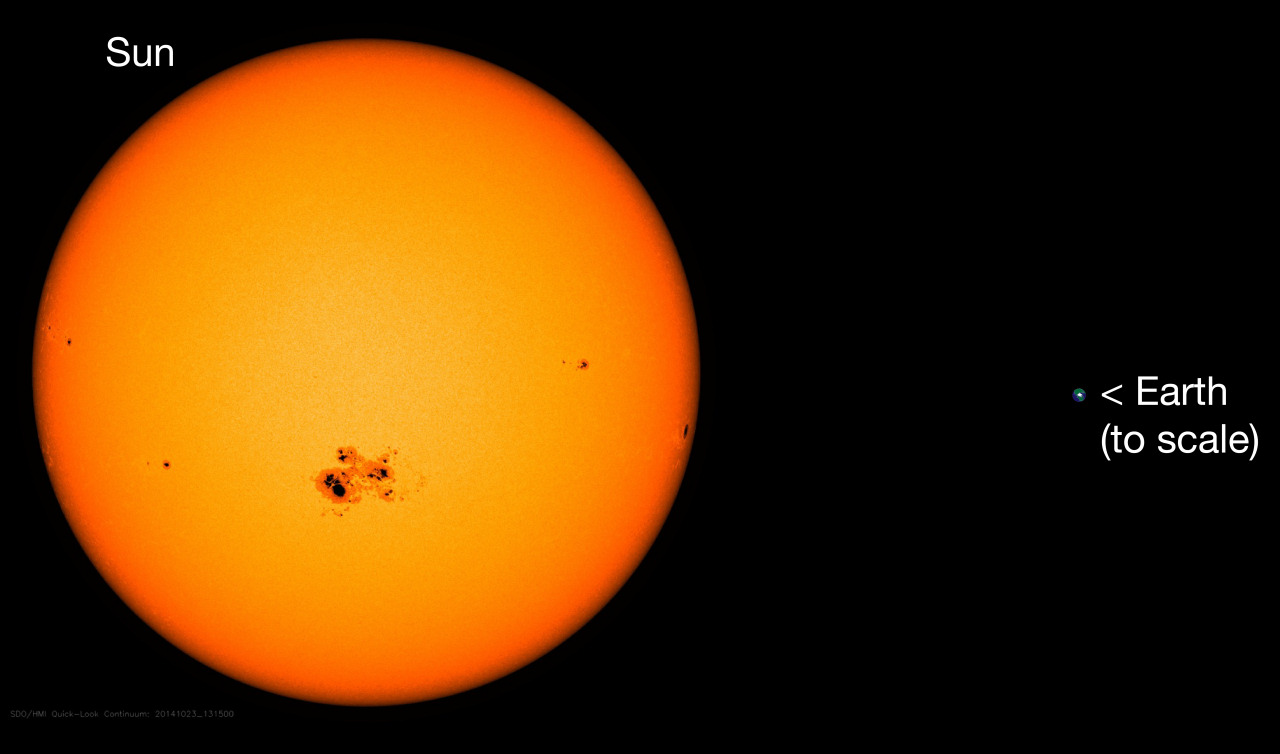
Image above: A photograph of the sun taken by NASA’s Solar Dynamics Laboratory showing sunspots many times larger than Earth from October 23, 2014, with the Earth added to scale by size. Distance is not to scale.
View this page as a printable (PDF) here: CAAG The Sun’s Impact on Climate Change
Key Takeaways:
- Scientific measurements show the Sun’s heat and energy output varies over time.
- Changes in the Sun’s heat and energy output have long been the most important factor driving climate change on Earth.
- A substantial increase in solar output during the 20th century likely explains much, and perhaps most, of recent warming.
Short Summary:
The Sun’s heat and energy output varies over time rather than being constant or steady.1 Scientists have been able to reconstruct the Sun’s heat output going back hundreds of years. The data show changes in global temperatures have almost perfectly mirrored variations in the Sun’s heat output throughout the past several hundred years, including during our current period of modest warming.
In Figure 1 below, scientists reconstructed changes in the Sun’s energy output going back to 1600 A.D. The data, published in the peer-reviewed journal Geophysical Research Letters, show the Sun’s energy output bottomed out in the 1600s, experienced a steep increase during the 1700s, plateaued in the 1800s, and then experienced another sharp increase during the 1900s.2
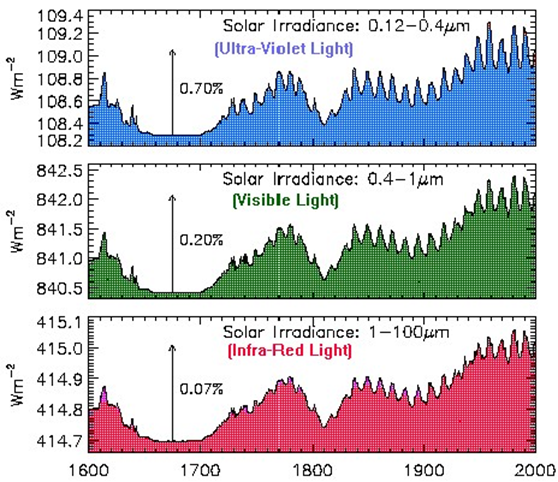
Figure 1. Changes in the Sun’s energy output since 1900. The Sun’s energy output has increased since the 1600’s with its most recent increase occurring during the 20th century. Source: J. Lean, Geophysical Research Letters, Vol 27, No. 16 (2000); https://agupubs.onlinelibrary.wiley.com/doi/epdf/10.1029/2000GL000043.
In the bottom image in Figure 2 below, the United Nations Intergovernmental Panel on Climate Change (IPCC) published Earth’s temperature history during the same time period as the chart above. According to the IPCC, Earth’s temperature changes since the 1600’s almost perfectly match changes in the Sun’s energy output throughout this time, including our period of recent warming.3
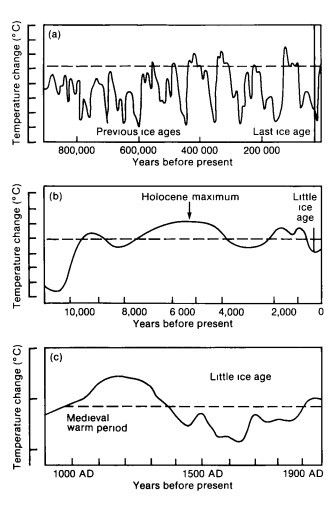
Figure 2: Temperature history according to the United Nations IPCC First Assessment Report. The top graph shows temperatures during the past 1 million years. The middle graph shows temperatures during the past 12,000 years. The bottom graph shows temperatures during the past 1,000 years. Present temperatures are at the far right. Temperatures in recent centuries closely mirror changes in the Sun’s output, as shown in Figure 1. Source: IPCC First Assessment Report, United Nations, p. 202, https://archive.ipcc.ch/ipccreports/far/wg_I/ipcc_far_wg_I_chapter_07.pdf.
In Figure 3 below, scientists have compared changes in the Sun’s energy output, changes in atmospheric carbon dioxide levels, and changes in Northern Hemisphere temperatures (which are similar to changes in global temperatures). The image on the left show temperatures during the past 100-plus years, which almost perfectly mirror changes in the Sun’s energy output. The image on the right show temperatures exhibiting little if any correlation with changes in Earth’s atmospheric carbon dioxide levels.4
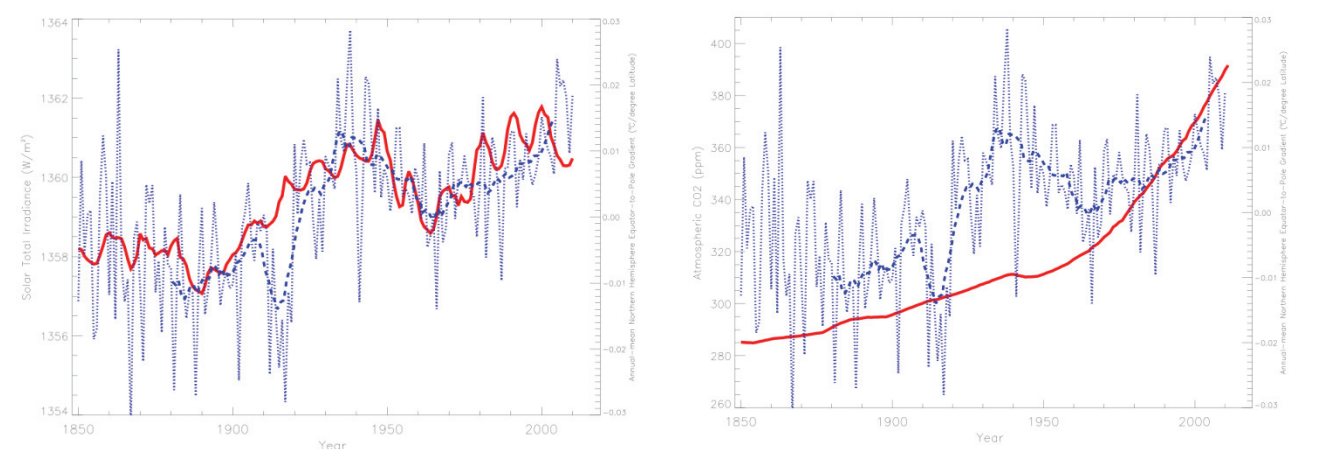 Figure 3: Temperature changes vs. changes in the Sun’s energy output and changes in atmospheric carbon dioxide concentrations. The graph on the left shows 20th century temperature changes in blue vs. changes in the Sun’s energy output in red. The graph on the right shows 20th century changes in blue vs. changes in atmospheric carbon dioxide emissions in red.
With global temperatures over many centuries mirroring changes in the Sun’s energy output, it is not surprising that the same correlation continues recently, as well.
Not only does an increase in the Sun’s energy output directly increase heating of the Earth, but scientists have presented evidence that increases in the Sun’s energy output increase the solar wind, which indirectly reduces the Earth’s cloud cover. Less cloud cover results in more sunlight hitting the surface of the Earth, which amplifies the impact of the direct increase in the Earth’s temperature from an increase in the Sun’s energy output. Other scientists have presented experimental evidence that solar activity influences the volume of cosmic rays entering the earth’s atmosphere, which also impacts cloud formation.5
References:
- R. Lindsey and R. Simmon, Under a Variable Sun, National Aeronautics and Space Administration, NASA Earth Observatory, accessed 2/13/24, https://earthobservatory.nasa.gov/features/VariableSun
- J. Lean, Evolution of the Sun’s Spectral Irradiance Since the Maunder Minimum, Geophysical Research Letters, Vol 27, No. 16 (2000) , accessed 2/13/24, https://agupubs.onlinelibrary.wiley.com/doi/epdf/10.1029/2000GL000043
- IPCC First Assessment Report, United Nations, p. 202, accessed 2/13/24, https://archive.ipcc.ch/ipccreports/far/wg_I/ipcc_far_wg_I_chapter_07.pdf
- W. Soon, C. Idso, and D. Legates, Solar irradiance modulation of Equator-to-Pole (Arctic) temperature gradients: Empirical evidence for climate variation on multi-decadal timescales, Journal of Atmospheric and Solar-Terrestrial Physics, 93, 45-56; accessed 2/13/24; https://www.sciencedirect.com/science/article/abs/pii/S136468261200288X;; and Idso, et al., Climate Change Reconsidered II: Physical Science, pp. 247-348; accessed 2/13/24, http://weather.missouri.edu/gcc/10-17-2013_ccr-ii_entire_book.pdf;
- H. Svensmark, et al., Atmospheric ionization and cloud radiative forcing, Scientific Reports, 11, Article number: 19668, accessed 2/13/24; https://www.nature.com/articles/s41598-021-99033-1 and E. Friis-Christensen and H. Svensmark, “What do we really know about the Sun-climate connection?,” Advances in Space Research, Volume 20, Issue 4-5, p. 913-921; accessed 2/13/24; https://citeseerx.ist.psu.edu/document?repid=rep1&type=pdf&doi=42c1443477fb6e34fff63442381560f9d433af7c
Climate At A Glance is a Project of The Heartland Institute
Email: think@heartland.org