Thirty years ago, Antarctica was barely losing ice mass, and this remains so. “Six times” almost no ice loss remains almost no ice loss.
When recent ice loss measurements are compared to the full Antarctic ice cap, the loss is so small that it is barely detectable.
Sea-levelmeasurements contradict claims that Antarctic ice loss threatens coastal flooding. NASA satellite instruments, with readings dating back to 1993, show global sea level rising at a pace of merely 1.2 inches per decade, which is not significantly different thansea-level rise since themid-1800s.
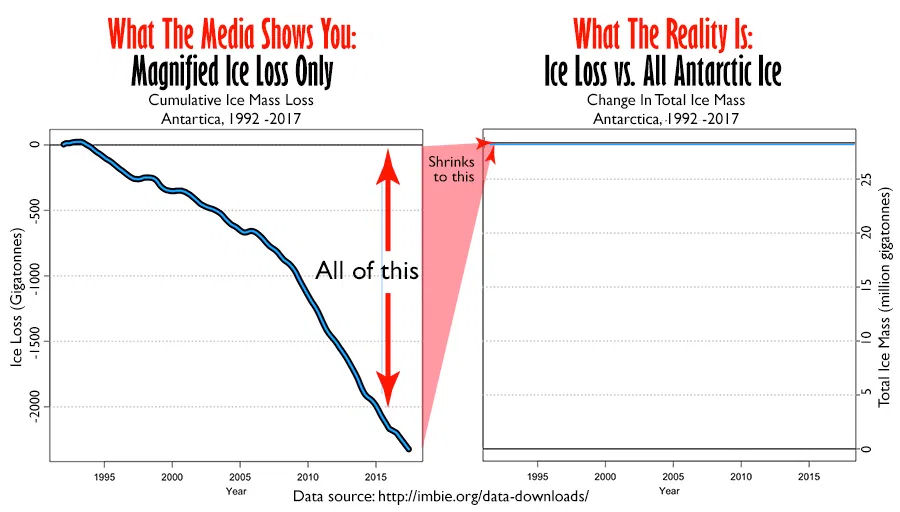
Short Summary:NASA and subsequent media stories have said this about Greenland and Antarctic ice: “The two regions have lost 6.4 trillion tons of ice in three decades; unabated, this rate of melting could cause flooding that affects hundreds of millions of people by 2100.” However, that is far short of even 1 percent of Greenland and Antarctic ice mass. As shown in the graph to the right in Figure 1 below, the total ice loss each year is a nearly undetectable three ten-thousandths of one percent (0.0003 percent) of the Antarctic ice mass.
Figure 1: (click to enlarge)Comparison of satellite data for Antarctic ice mass loss. Cumulative ice mass loss on the left and that same data compared to the total mass of ice on the right. Data source: http://imbie.org. Graphs originally by Willis Eshenbach, adapted and annotated by Anthony Watts.
The data plotted in the graphs above is from the ice sheet mass balance inter-comparison exercise (IMBIE), a joint exercise by NASA and the European Space Agency, http://imbie.org/about-the-project/
Thirty years ago, Antarctica was barely losing ice mass, and this remains so. “Six times” almost no ice loss remains almost no ice loss.
When recent ice loss measurements are compared to the full Antarctic ice cap, the loss is so small that it is barely detectable.
Sea-levelmeasurements contradict claims that Antarctic ice loss threatens coastal flooding. NASA satellite instruments, with readings dating back to 1993, show global sea level rising at a pace of merely 1.2 inches per decade, which is not significantly different thansea-level rise since themid-1800s.
Short Summary:NASA and subsequent media stories have said this about Greenland and Antarctic ice: “The two regions have lost 6.4 trillion tons of ice in three decades; unabated, this rate of melting could cause flooding that affects hundreds of millions of people by 2100.” However, that is far short of even 1 percent of Greenland and Antarctic ice mass. As shown in the graph to the right in Figure 1 below, the total ice loss each year is a nearly undetectable three ten-thousandths of one percent (0.0003 percent) of the Antarctic ice mass.
Figure 1: (click to enlarge)Comparison of satellite data for Antarctic ice mass loss. Cumulative ice mass loss on the left and that same data compared to the total mass of ice on the right. Data source: http://imbie.org. Graphs originally by Willis Eshenbach, adapted and annotated by Anthony Watts.
The data plotted in the graphs above is from the ice sheet mass balance inter-comparison exercise (IMBIE), a joint exercise by NASA and the European Space Agency, http://imbie.org/about-the-project/
We use cookies to ensure that we give you the best experience on our website. If you continue to use this site we will assume that you are happy with it.