NASA satellite imagery analysis shows significant plant growth globally over the past 35 years.
Research from NASA as well as multiple other studies conclude that the increased plant growth is a response to rising carbon dioxide in Earth’s atmosphere creating better growing conditions.
The increased plant coverage mitigates surface warming due to increased efficiency of heat and water vapor transfer to the atmosphere.
Short Summary:
Plant life is integral to the biosphere.1 Plants take CO2 in, and in the process of photosynthesis, turn it into oxygen and water vapor which is released into the atmosphere. During photosynthesis plants combine water, CO2, nutrients, and energy (light), to grow.2
Liebig’s Law of the Minimum, which defines the most limiting resource in photosynthesis, says that if one of those elements increases, all other elements remaining equal, growth will occur.3 Carbon dioxide concentration has increased in Earth’s atmosphere over the last century, and plants have benefitted from the extra CO2, producing a general greening of the earth.4
NASA satellite imagery has recorded this greening which is reflected in the Normalized Difference Vegetation Index (NDVI), created to measure the vegetative cover on the land surface.5 NDVI also identifies water, deserts, and ice.
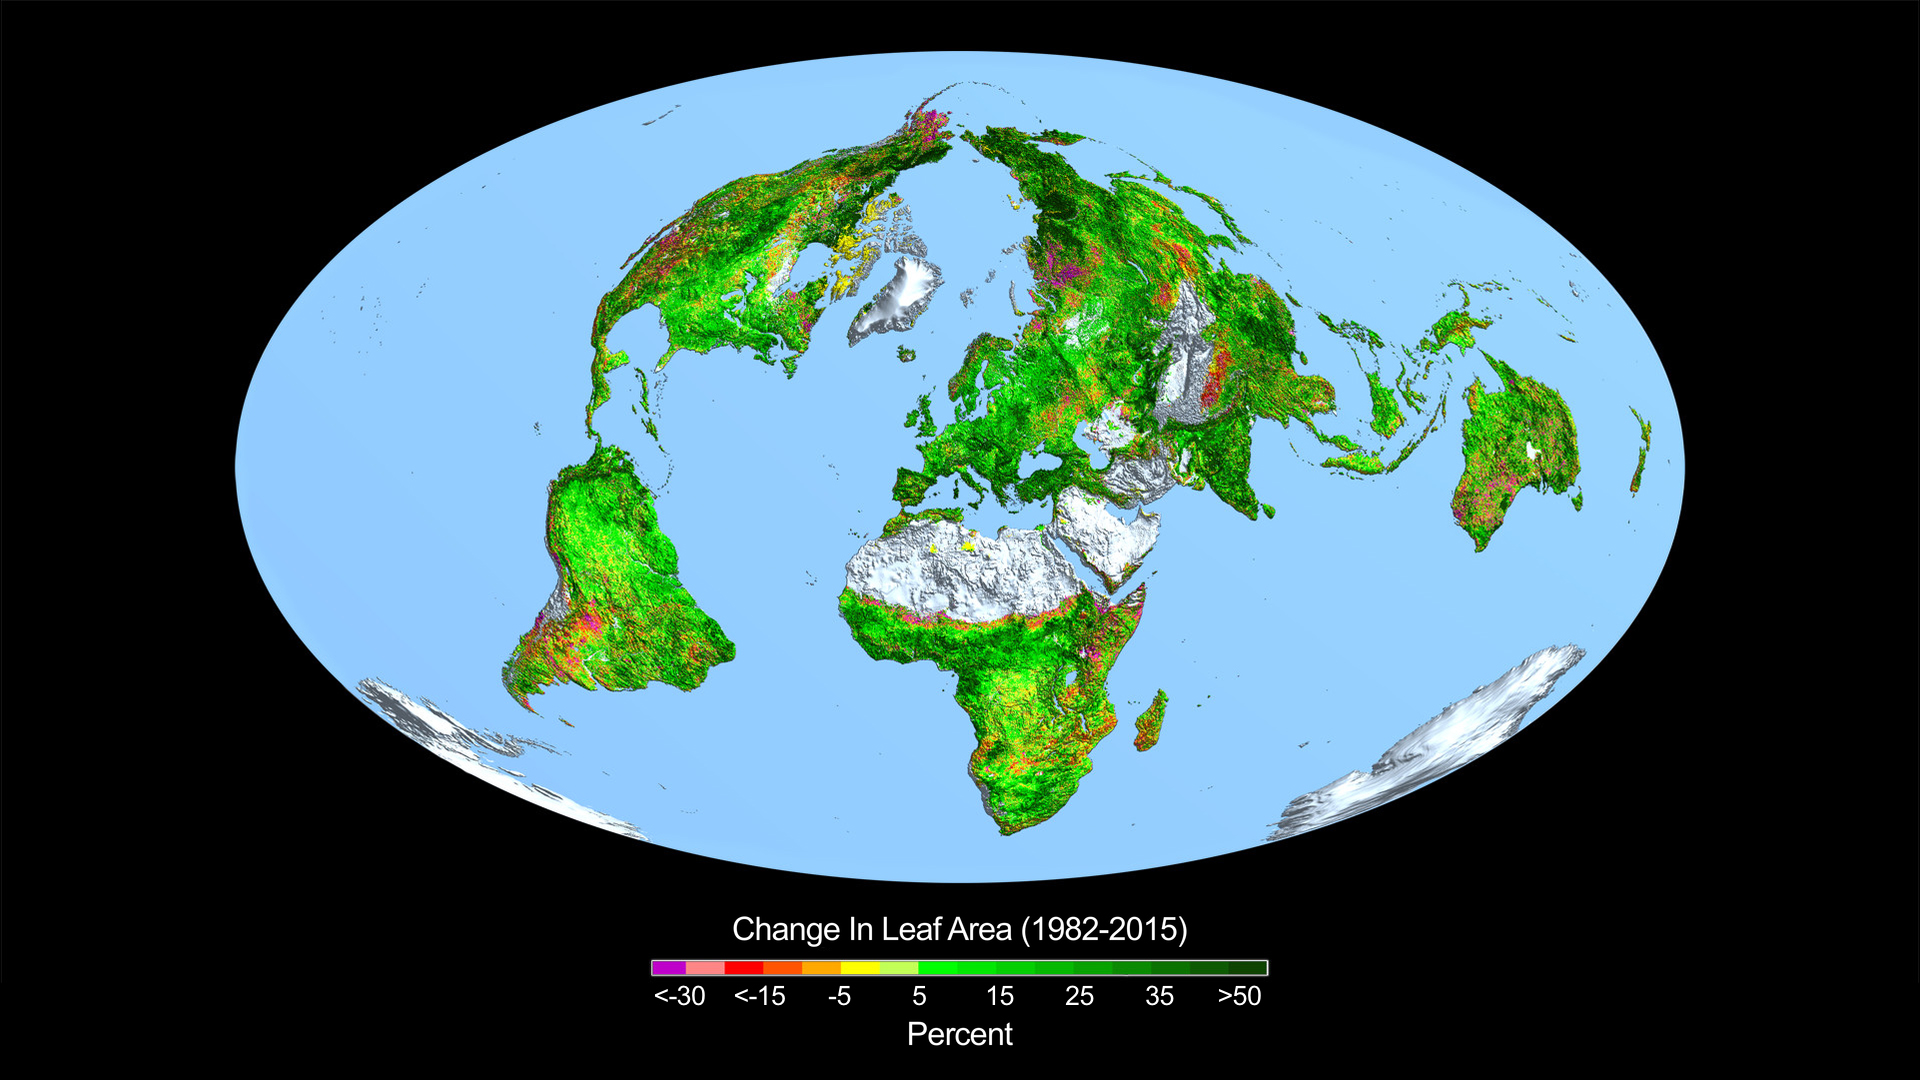
In 2016, NASA reported that up to half of Earth’s vegetated lands have shown significant greening during the preceding 35 years, largely due to rising levels of atmospheric carbon dioxide. NASA measured a 10 percent greening of the earth between 2000 and 2020, alone. The greening represents a net increase in leaves on plants and trees equivalent in area to two times the size of the continental United States.6 (See Figure 1 below)
Figure 1. This image shows the change in leaf area across the globe from 1982-2015 detected by satellite. Credits: Boston University/R. Myneni. Image source: NASA
NASA’s results confirm earlier research which found that the 14 percent increase in atmospheric CO2 between 1982 and 2010 resulted in a 5-to-10 percent increase in green foliage cover in warm, arid environments.7
Plant life is not just expanding in temperate regions. A 2018 study found the Sahara Desert had shrunk in area by 8 percent over the previous three decades, due a CO2 fertilization induced expansion of plant coverage.8
Follow-up studies in 2018 and 2020, showed that on a global scale: greening can be attributed to the increase of carbon dioxide in the atmosphere; it has produced a beneficial cooling effect; and the increased plant growth is acting as a significant carbon sink.910
The 2018 study noted, “. . . global greening since the early 1980s may have reduced global warming by as much as 0.2° to 0.25° Celsius (0.36° to 0.45° Fahrenheit).”
Global Change Biology, Volume 26, Issue 4 p. 2390-2402, accessed 08/18/23, Higher than expected CO2 fertilization inferred from leaf to global observations, https://doi.org/10.1111/gcb.14950
NASA satellite imagery analysis shows significant plant growth globally over the past 35 years.
Research from NASA as well as multiple other studies conclude that the increased plant growth is a response to rising carbon dioxide in Earth’s atmosphere creating better growing conditions.
The increased plant coverage mitigates surface warming due to increased efficiency of heat and water vapor transfer to the atmosphere.
Short Summary:
Plant life is integral to the biosphere.1 Plants take CO2 in, and in the process of photosynthesis, turn it into oxygen and water vapor which is released into the atmosphere. During photosynthesis plants combine water, CO2, nutrients, and energy (light), to grow.2
Liebig’s Law of the Minimum, which defines the most limiting resource in photosynthesis, says that if one of those elements increases, all other elements remaining equal, growth will occur.3 Carbon dioxide concentration has increased in Earth’s atmosphere over the last century, and plants have benefitted from the extra CO2, producing a general greening of the earth.4
NASA satellite imagery has recorded this greening which is reflected in the Normalized Difference Vegetation Index (NDVI), created to measure the vegetative cover on the land surface.5 NDVI also identifies water, deserts, and ice.
In 2016, NASA reported that up to half of Earth’s vegetated lands have shown significant greening during the preceding 35 years, largely due to rising levels of atmospheric carbon dioxide. NASA measured a 10 percent greening of the earth between 2000 and 2020, alone. The greening represents a net increase in leaves on plants and trees equivalent in area to two times the size of the continental United States.6 (See Figure 1 below)
Figure 1. This image shows the change in leaf area across the globe from 1982-2015 detected by satellite. Credits: Boston University/R. Myneni. Image source: NASA
NASA’s results confirm earlier research which found that the 14 percent increase in atmospheric CO2 between 1982 and 2010 resulted in a 5-to-10 percent increase in green foliage cover in warm, arid environments.7
Plant life is not just expanding in temperate regions. A 2018 study found the Sahara Desert had shrunk in area by 8 percent over the previous three decades, due a CO2 fertilization induced expansion of plant coverage.8
Follow-up studies in 2018 and 2020, showed that on a global scale: greening can be attributed to the increase of carbon dioxide in the atmosphere; it has produced a beneficial cooling effect; and the increased plant growth is acting as a significant carbon sink.910
The 2018 study noted, “. . . global greening since the early 1980s may have reduced global warming by as much as 0.2° to 0.25° Celsius (0.36° to 0.45° Fahrenheit).”
Global Change Biology, Volume 26, Issue 4 p. 2390-2402, accessed 08/18/23, Higher than expected CO2 fertilization inferred from leaf to global observations, https://doi.org/10.1111/gcb.14950
We use cookies to ensure that we give you the best experience on our website. If you continue to use this site we will assume that you are happy with it.