Natural vs. Human Contributions to Greenhouse Gases and Global Average Temperatures
Above: A graphical representation of a Carbon Dioxide molecule showing one carbon atom and two oxygen atoms.
View this page as a printable PDF here.
Key Takeaways:
Throughout Earth’s history, atmospheric Carbon Dioxide (CO2) levels have waxed and waned, but over time, there has been a long slow drawdown of CO2.1
Recent increases in atmospheric CO2 began around 1850, well before electric power generation and the internal combustion engine were common features of society.
The 1850 start point coincided with the end of the cold period known as the Little Ice Age, suggesting a natural rise in temperature increased global CO2 concentrations from the oceans.
Humans contribute approximately 3.4 percent of annual CO2 emissions today, but only 0.28 percent of the greenhouse warming effect on Earth.
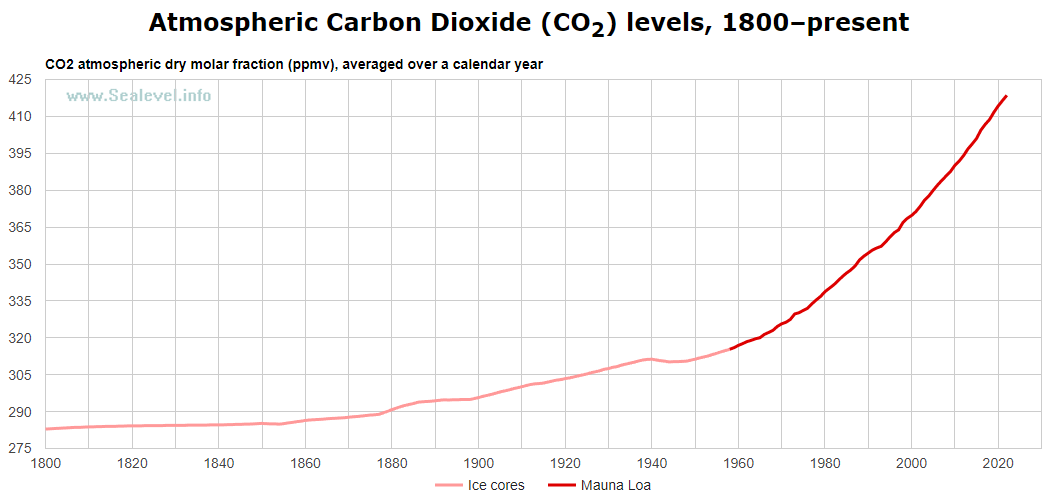
Carbon Dioxide (CO2) has been directly measured in Earth’s atmosphere since 1958.4 CO2 concentrations are increasing in the atmosphere, in large part due to human activities, such as emissions from the burning of fossil fuels for energy. 5 Computer models project that rising CO2 concentrations will cause an increase in average global temperature through the greenhouse effect.6
The global atmospheric CO2 concentration trend is seen in Figure 1.
Figure 1: Global CO2 levels in parts per million since 1800, based on ice core samples and atmospheric measurements since 1958. Note that CO2 levels began an uptick in 1850 at the end of the Little Ice Age. Data Sources: sealevel.info, NOAA Mauna Loa Observatory, and NOAA ice core data. See references 7,8,9.
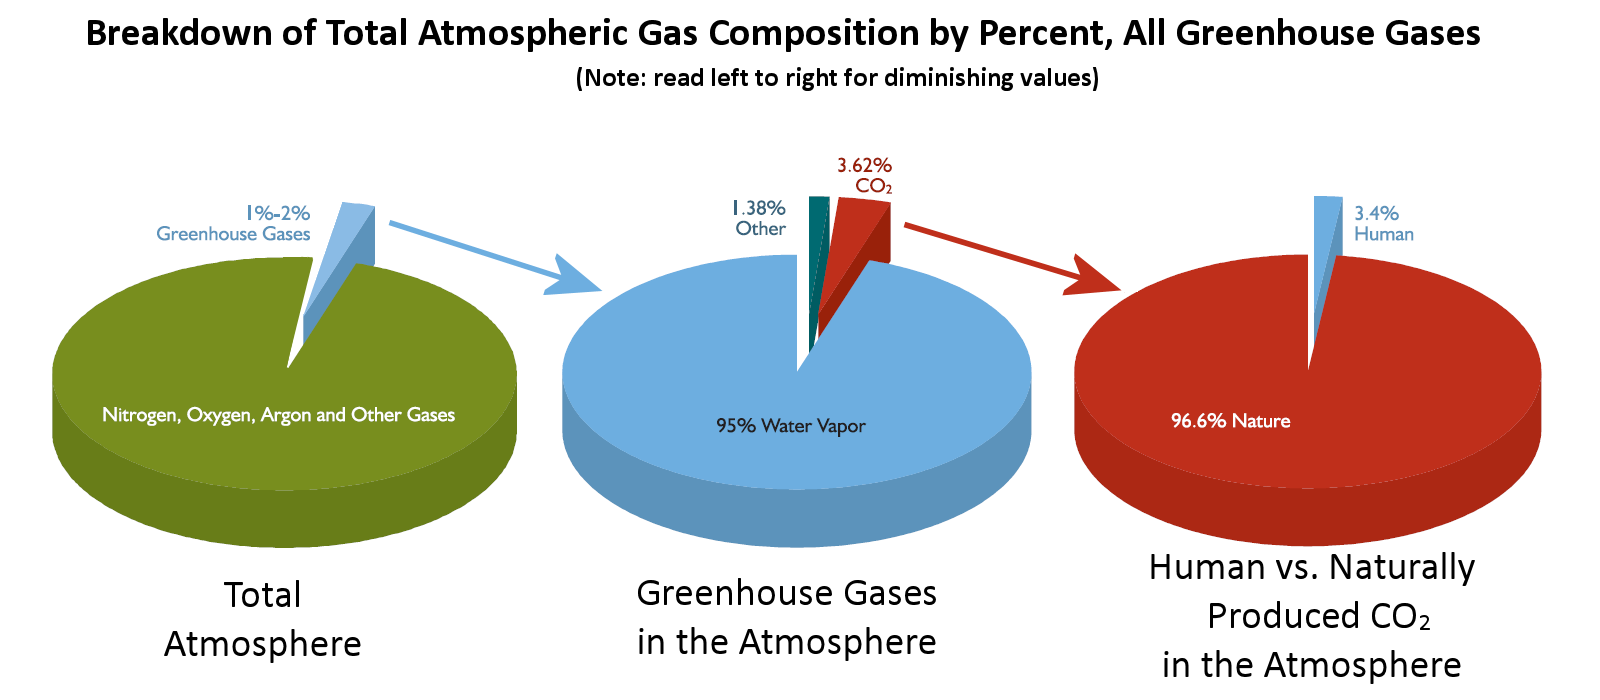
Greenhouse gases make up no more than 2 percent of the Earth’s atmosphere.
Humans contribute approximately 3.4 percent of annual CO2 12 The remaining 96.6 percent are from natural sources, like volcanoes, decaying plants/biomass, and animal activity, seen in Figure 2, below.
CO2 and other trace gases are only 5 percent of the greenhouse gases in the atmosphere. Water vapor makes up the other 95 percent and is the main warming driver of the greenhouse effect, contributing 97 percent of the total warming effect on Earth, seen in Figure 3 below.
Figure 2: A breakdown of total atmospheric composition, all greenhouse gases, and human versus naturally produced carbon dioxide in Earth’s atmosphere. Graphic by A. Watts adopted from NCPA. See Reference 14.
Looking at all sources for the greenhouse effect shows human emissions only contribute 0.28 percent of the warming on Earth. Water vapor provides 97 percent of the warming effect in Earth’s atmosphere.13
Put another way, humanity is responsible for about one-quarter of 1 percent of the greenhouse effect. The remainder is natural. (See Figure 3, below).
Figure 3: Breakdown of percentages of Earth’s greenhouse warming by source. Water vapor source updated to use MIT value of 97 percent.13 Graphic by A. Watts adopted from original NCPA graphic. See reference 14.
Above: A graphical representation of a Carbon Dioxide molecule showing one carbon atom and two oxygen atoms.
View this page as a printable PDF here.
Key Takeaways:
Throughout Earth’s history, atmospheric Carbon Dioxide (CO2) levels have waxed and waned, but over time, there has been a long slow drawdown of CO2.1
Recent increases in atmospheric CO2 began around 1850, well before electric power generation and the internal combustion engine were common features of society.
The 1850 start point coincided with the end of the cold period known as the Little Ice Age, suggesting a natural rise in temperature increased global CO2 concentrations from the oceans.
Humans contribute approximately 3.4 percent of annual CO2 emissions today, but only 0.28 percent of the greenhouse warming effect on Earth.
Carbon Dioxide (CO2) has been directly measured in Earth’s atmosphere since 1958.4 CO2 concentrations are increasing in the atmosphere, in large part due to human activities, such as emissions from the burning of fossil fuels for energy. 5 Computer models project that rising CO2 concentrations will cause an increase in average global temperature through the greenhouse effect.6
The global atmospheric CO2 concentration trend is seen in Figure 1.
Figure 1: Global CO2 levels in parts per million since 1800, based on ice core samples and atmospheric measurements since 1958. Note that CO2 levels began an uptick in 1850 at the end of the Little Ice Age. Data Sources: sealevel.info, NOAA Mauna Loa Observatory, and NOAA ice core data. See references 7,8,9.
Greenhouse gases make up no more than 2 percent of the Earth’s atmosphere.
Humans contribute approximately 3.4 percent of annual CO2 12 The remaining 96.6 percent are from natural sources, like volcanoes, decaying plants/biomass, and animal activity, seen in Figure 2, below.
CO2 and other trace gases are only 5 percent of the greenhouse gases in the atmosphere. Water vapor makes up the other 95 percent and is the main warming driver of the greenhouse effect, contributing 97 percent of the total warming effect on Earth, seen in Figure 3 below.
Figure 2: A breakdown of total atmospheric composition, all greenhouse gases, and human versus naturally produced carbon dioxide in Earth’s atmosphere. Graphic by A. Watts adopted from NCPA. See Reference 14.
Looking at all sources for the greenhouse effect shows human emissions only contribute 0.28 percent of the warming on Earth. Water vapor provides 97 percent of the warming effect in Earth’s atmosphere.13
Put another way, humanity is responsible for about one-quarter of 1 percent of the greenhouse effect. The remainder is natural. (See Figure 3, below).
Figure 3: Breakdown of percentages of Earth’s greenhouse warming by source. Water vapor source updated to use MIT value of 97 percent.13 Graphic by A. Watts adopted from original NCPA graphic. See reference 14.
We use cookies to ensure that we give you the best experience on our website. If you continue to use this site we will assume that you are happy with it.