Average North American snowpack extent is virtually unchanged in recent years compared to the late 1960s, when satellite measurements began.
Following a short-term decline in snowpack in the mid-1980s, average North American snowpack has increased.
There has been only a modest decline in Eurasian snowpack in recent years.
Short Summary:
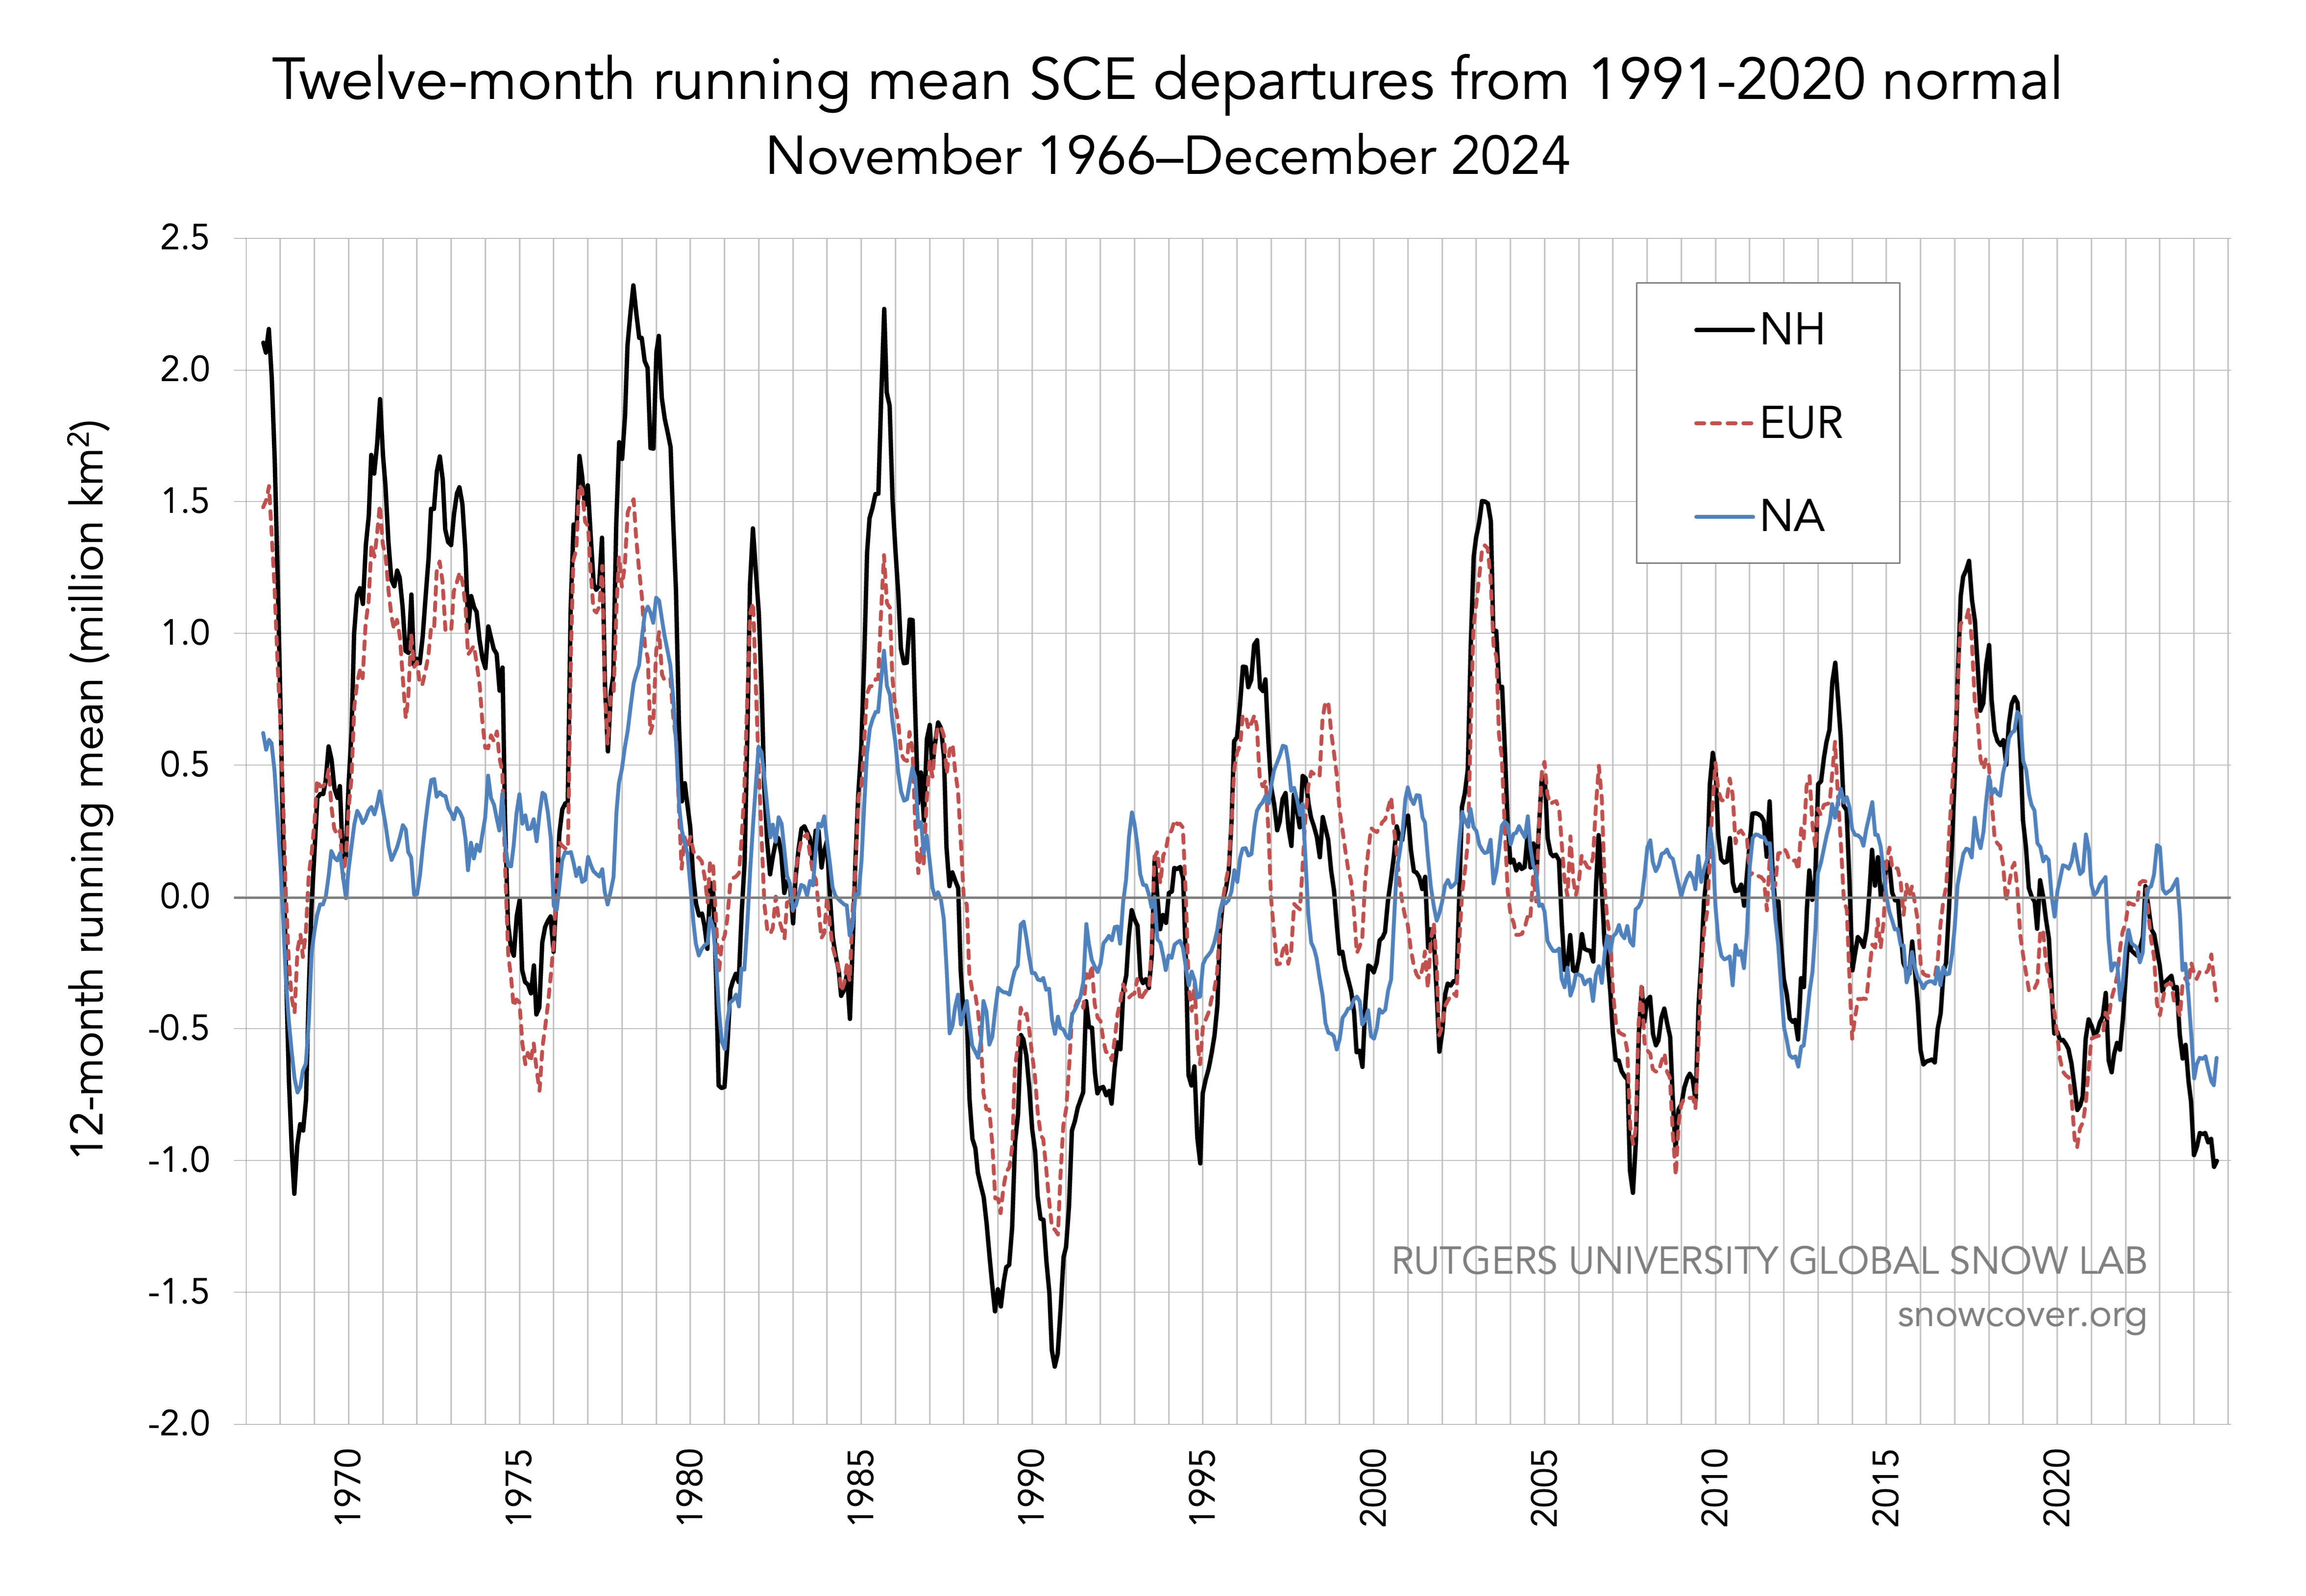
NASA satellites have measured snow cover since 1966.1 The lines graphed in Figure 1 represent 12-month snow cover anomalies, which are a departure from a defined reference point. The blue dots represent North American snow cover totals. Note that they show almost no declining trend since 1966, and a rising trend since the late 1980s.2 Further, the Eurasian snow data appearing in Figure 1 illustrate there has been a modest decline in Eurasian snow since the 1960s, but that there has also been an increase in snow coverage since the late 1980s.
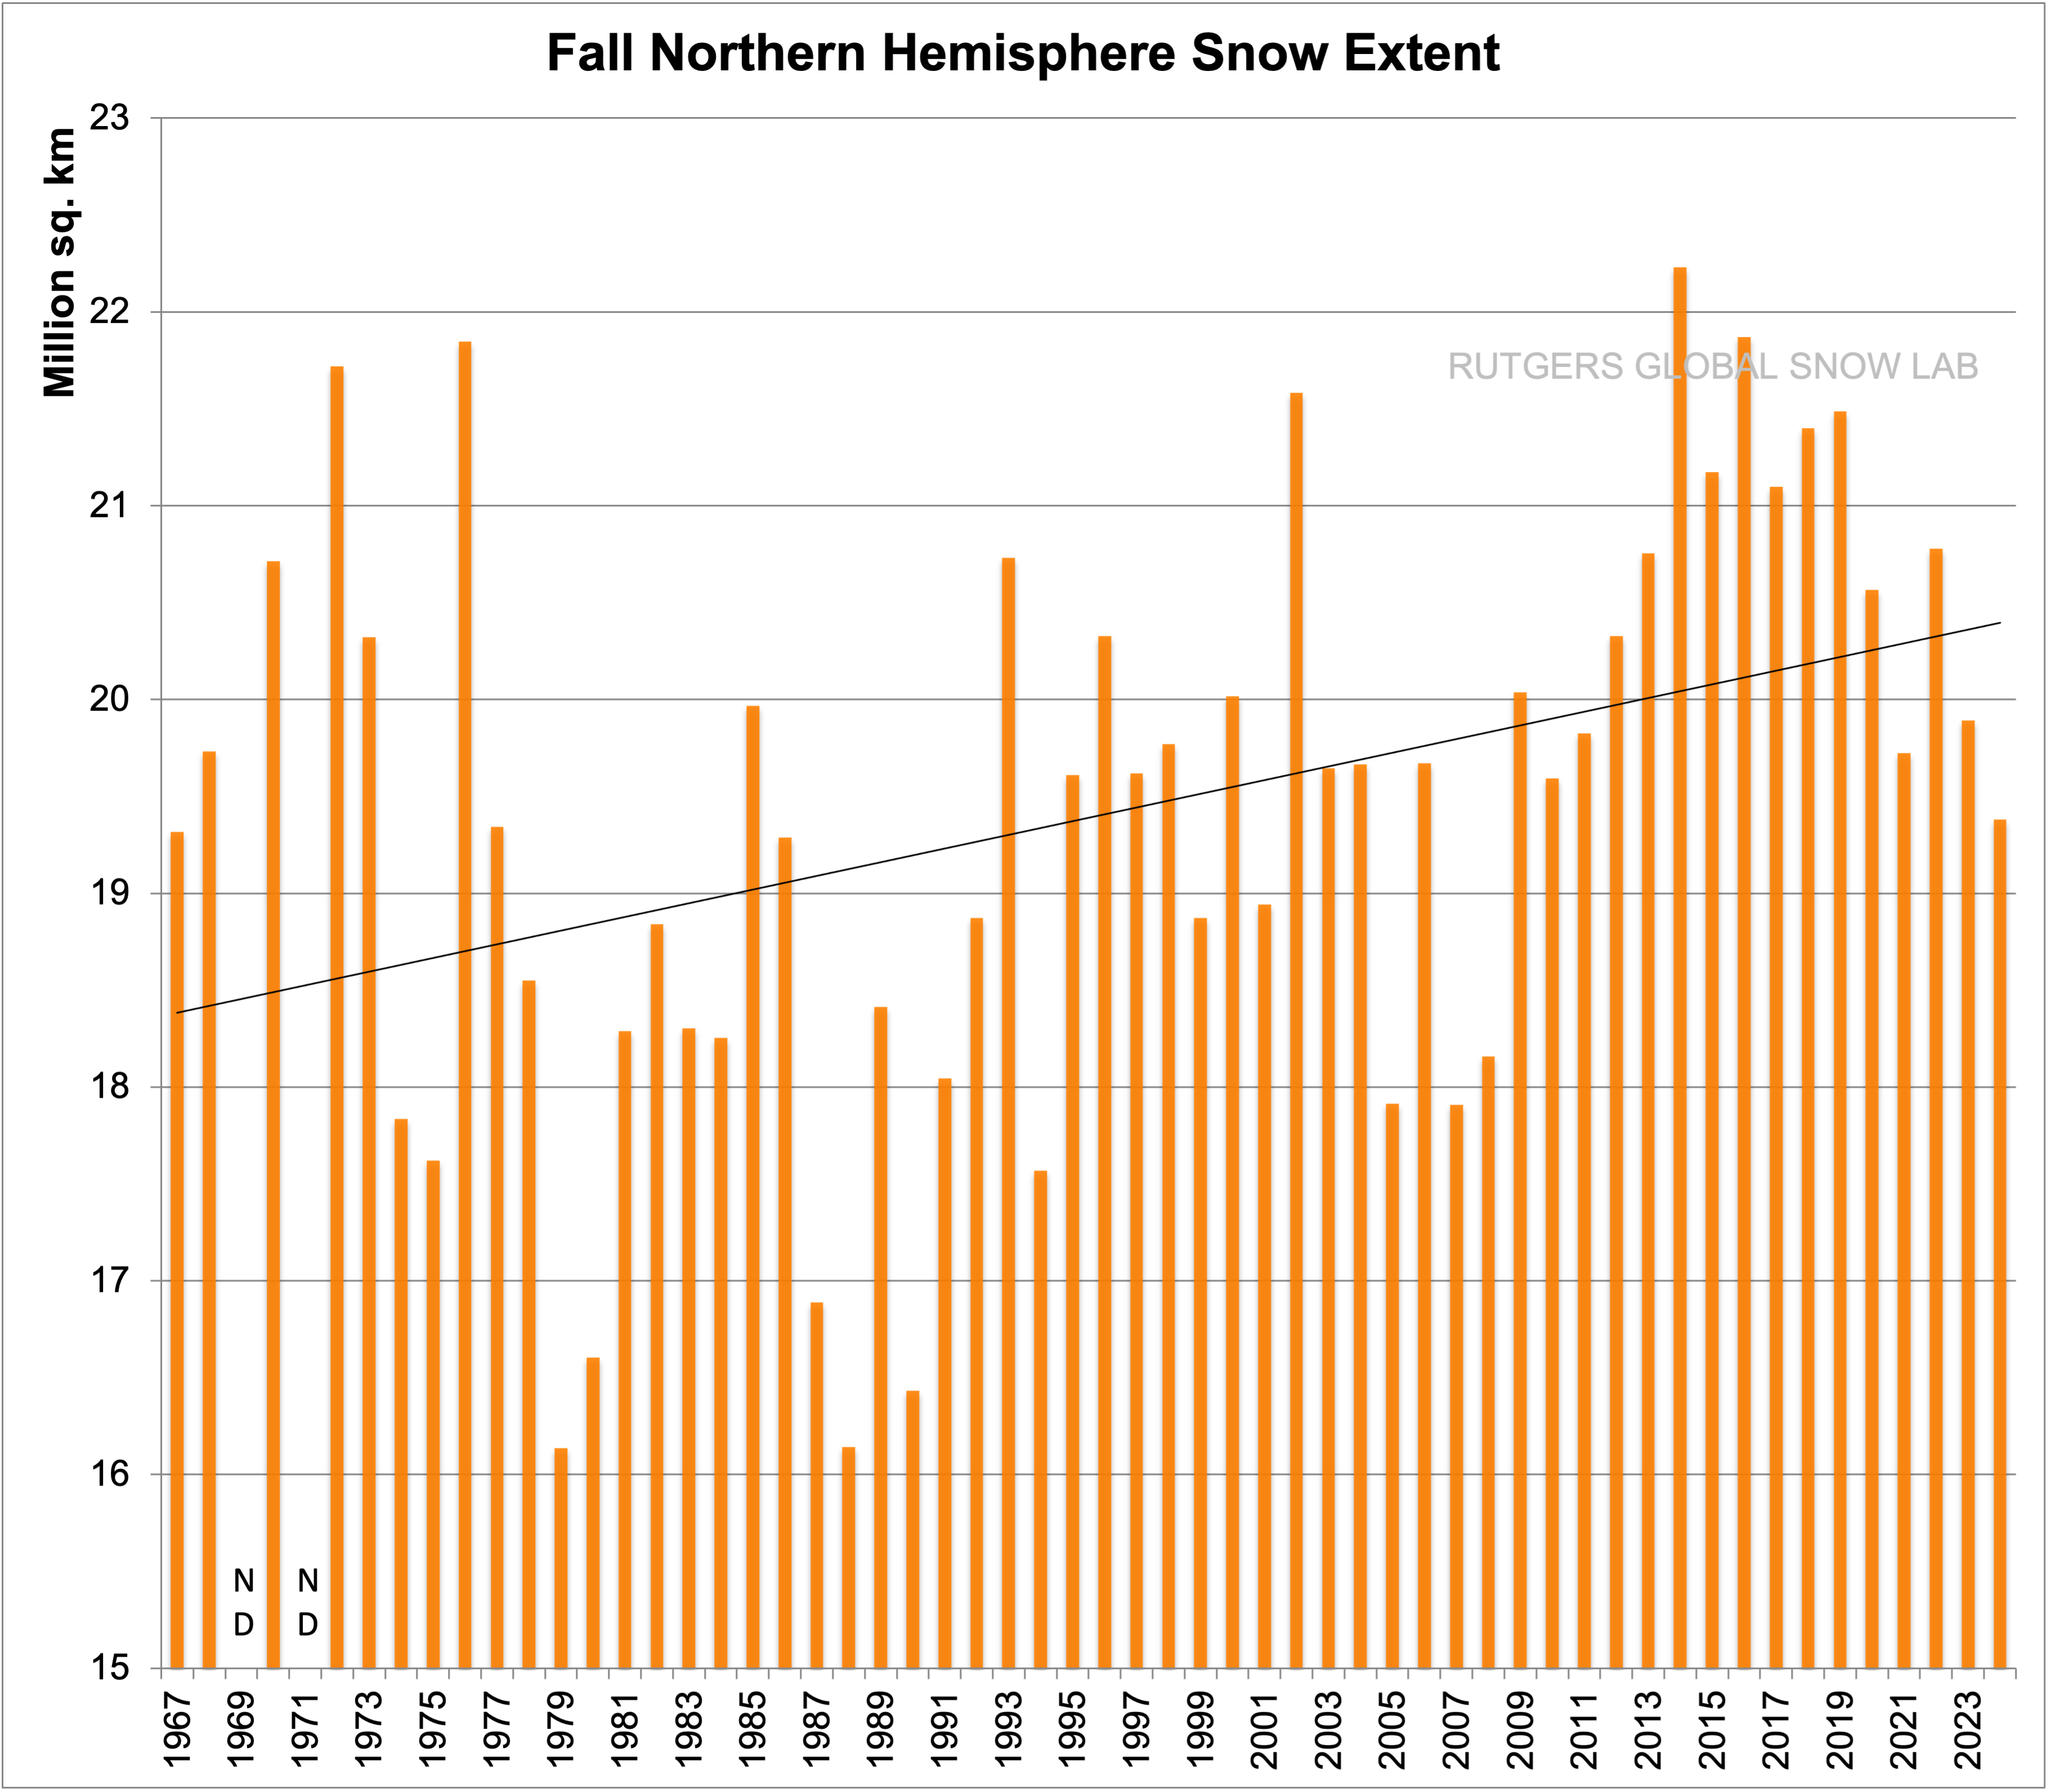
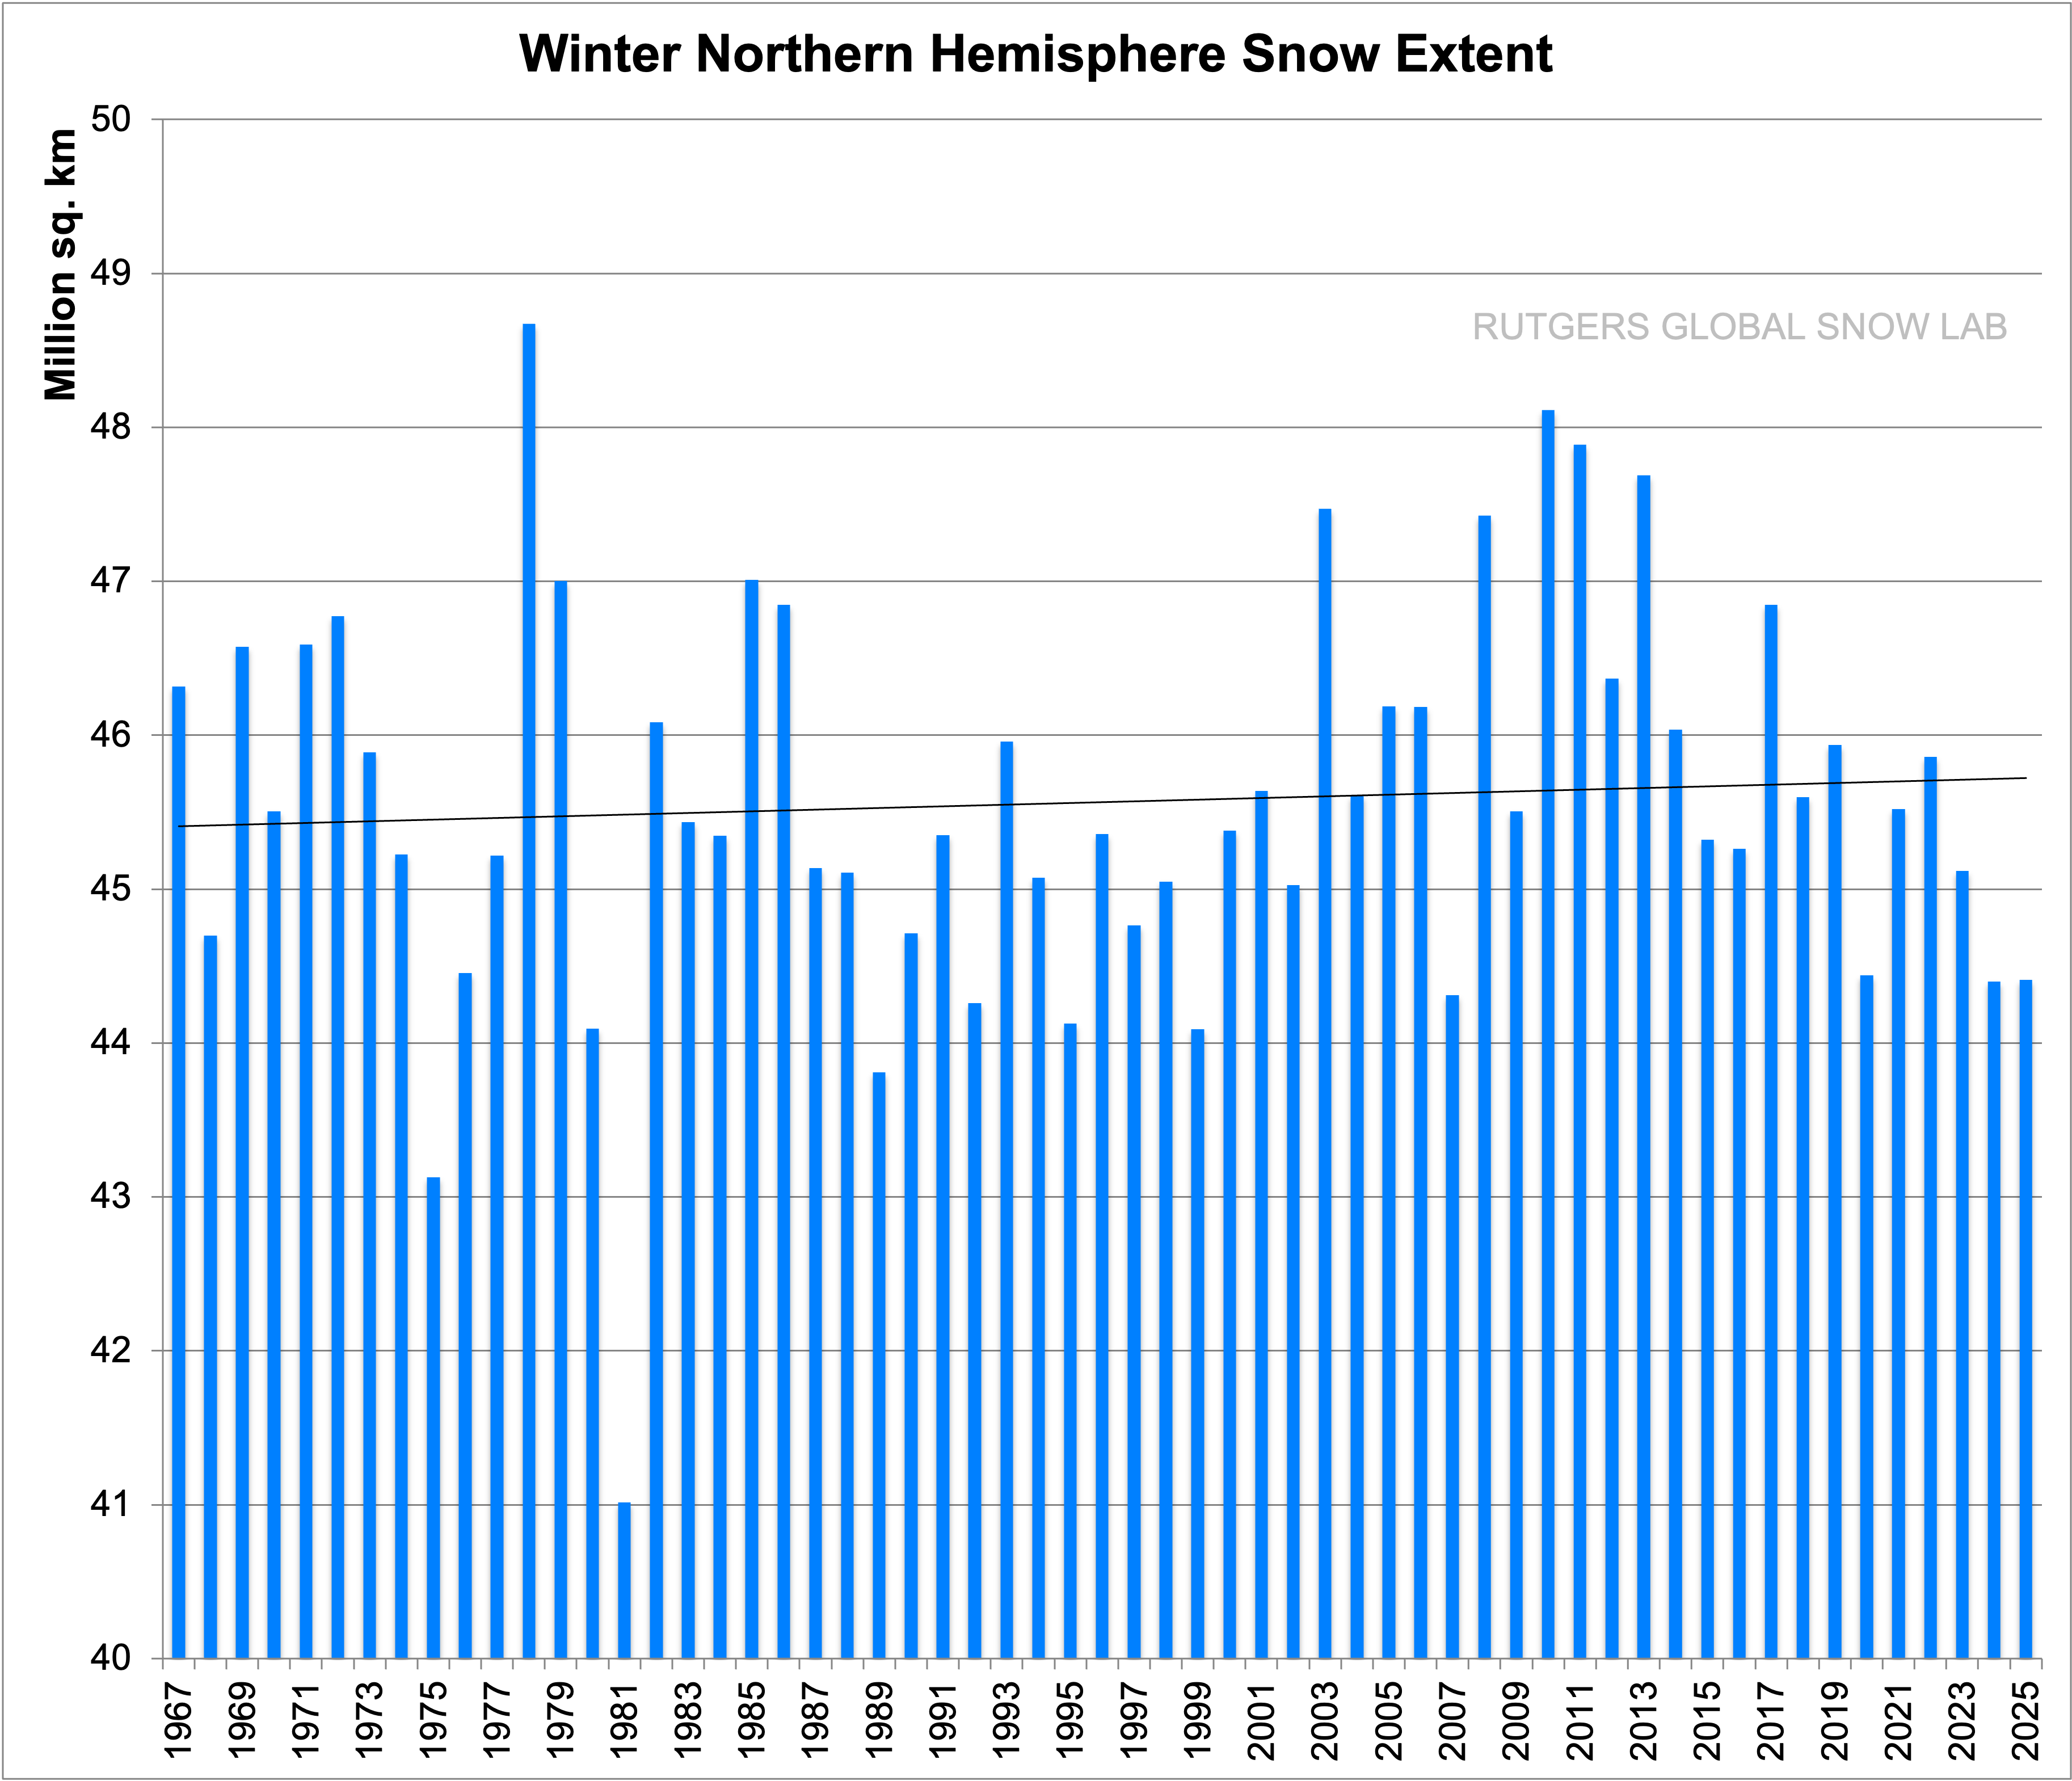
On a seasonal basis, snowpack throughout the Northern Hemisphere has increased over the past several decades in the fall and winter, as shown in Figures 2 and 3. As these and other data reveal, the only long-term negative overall snow-cover trends occurring in recent decades have been limited to spring snow cover, primarily in Eurasia.
North American snow cover remains approximately the same today as when coverage was first precisely measured in the 1960s, and snow cover has been increasing since the late 1980s.
Figure 1. 12-Month Running Mean Snow Cover Anomalies, November 1966–December 2022
Figure 1:(click to enlarge) Twelve-month running anomalies of monthly snow extent, from November 1966 to October Note that North America, represented by the blue dots, remains virtually unchanged in recent years compared to the late 1960s, when satellite measurements first began. Source: Global Snow Lab, “12-month Running Anomalies of Monthly Snow Extent from November 1966 to December 2024,” Rutgers University Climate Lab, May 27, 2025, https://climate.rutgers.edu/snowcover/chart_anom.php?ui_set=0&ui_region=nhland&ui_month=2.
Figure 2. Fall Northern Hemisphere Snow Extent
Figure 2:(click to enlarge) This figure displays fall Northern Hemisphere snow extent. Note that Figure 2 shows that snow cover throughout the Northern Hemisphere has increased during the fall months since the 1960s. (The “ND” in the chart indicates no data for a given year.) Source: Global Snow Lab, “Fall Northern Hemisphere Snow Extent,” Rutgers University Climate Lab, accessed May 27, 2025, https://climate.rutgers.edu/snowcover/chart_seasonal.php?ui_set=nhland&ui_season=4.
Figure 3. Winter Northern Hemisphere Snow Extent
Figure 3: (click to enlarge) This chart shows winter Northern Hemisphere snow extent. Note that global snow cover throughout the Northern Hemisphere has increased during the winter months since the 1960s. Source: Global Snow Lab, “Winter Northern Hemisphere Snow Extent,” Rutgers University Climate Lab, accessed May 27, 2025, https://climate.rutgers.edu/snowcover/chart_seasonal.php?ui_set=nhland&ui_season=1.
Average North American snowpack extent is virtually unchanged in recent years compared to the late 1960s, when satellite measurements began.
Following a short-term decline in snowpack in the mid-1980s, average North American snowpack has increased.
There has been only a modest decline in Eurasian snowpack in recent years.
Short Summary:
NASA satellites have measured snow cover since 1966.1 The lines graphed in Figure 1 represent 12-month snow cover anomalies, which are a departure from a defined reference point. The blue dots represent North American snow cover totals. Note that they show almost no declining trend since 1966, and a rising trend since the late 1980s.2 Further, the Eurasian snow data appearing in Figure 1 illustrate there has been a modest decline in Eurasian snow since the 1960s, but that there has also been an increase in snow coverage since the late 1980s.
On a seasonal basis, snowpack throughout the Northern Hemisphere has increased over the past several decades in the fall and winter, as shown in Figures 2 and 3. As these and other data reveal, the only long-term negative overall snow-cover trends occurring in recent decades have been limited to spring snow cover, primarily in Eurasia.
North American snow cover remains approximately the same today as when coverage was first precisely measured in the 1960s, and snow cover has been increasing since the late 1980s.
Figure 1. 12-Month Running Mean Snow Cover Anomalies, November 1966–December 2022
Figure 1:(click to enlarge) Twelve-month running anomalies of monthly snow extent, from November 1966 to October Note that North America, represented by the blue dots, remains virtually unchanged in recent years compared to the late 1960s, when satellite measurements first began. Source: Global Snow Lab, “12-month Running Anomalies of Monthly Snow Extent from November 1966 to December 2024,” Rutgers University Climate Lab, May 27, 2025, https://climate.rutgers.edu/snowcover/chart_anom.php?ui_set=0&ui_region=nhland&ui_month=2.
Figure 2. Fall Northern Hemisphere Snow Extent
Figure 2:(click to enlarge) This figure displays fall Northern Hemisphere snow extent. Note that Figure 2 shows that snow cover throughout the Northern Hemisphere has increased during the fall months since the 1960s. (The “ND” in the chart indicates no data for a given year.) Source: Global Snow Lab, “Fall Northern Hemisphere Snow Extent,” Rutgers University Climate Lab, accessed May 27, 2025, https://climate.rutgers.edu/snowcover/chart_seasonal.php?ui_set=nhland&ui_season=4.
Figure 3. Winter Northern Hemisphere Snow Extent
Figure 3: (click to enlarge) This chart shows winter Northern Hemisphere snow extent. Note that global snow cover throughout the Northern Hemisphere has increased during the winter months since the 1960s. Source: Global Snow Lab, “Winter Northern Hemisphere Snow Extent,” Rutgers University Climate Lab, accessed May 27, 2025, https://climate.rutgers.edu/snowcover/chart_seasonal.php?ui_set=nhland&ui_season=1.
We use cookies to ensure that we give you the best experience on our website. If you continue to use this site we will assume that you are happy with it.