Lake Mead water levels rose steadily from 1965 to 1983, setting record-high levels in 1983.
For all but two years of the three decades running from 1973 to 2002, water levels remained above average, the longest such period on record.
After nearly 30 years of abundance, a decline was bound to eventually occur.
Rainfall has been below average in recent years in the Colorado River Basin, but above average nationally.
Some regions of the world are always going to be drier than others, with or without global warming.
Short Summary:
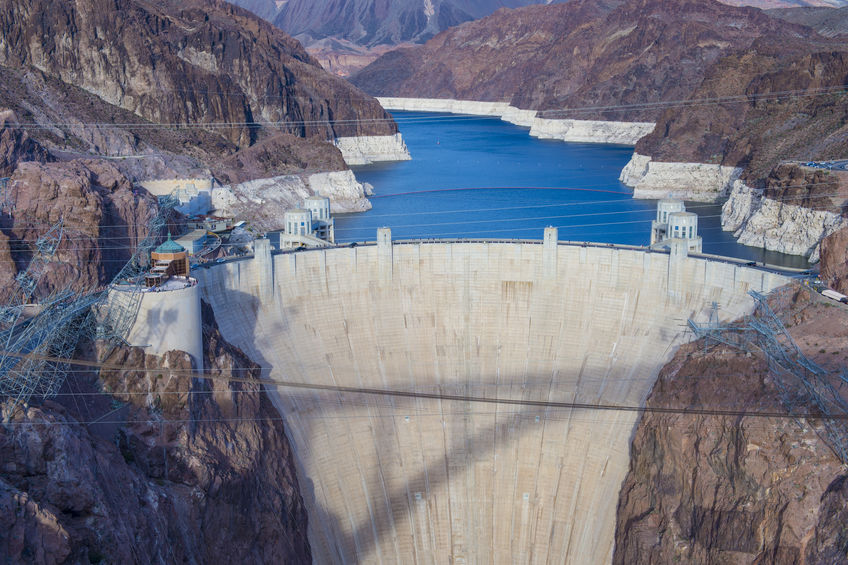
For most of the past half-century, Lake Mead has enjoyed above average water levels.1 Lake Mead water levels rose steadily for 18 years, from 1965 to 1983, and they remained above average for most of the three decade period from 1973 to 2002.
At some point, lower water levels are bound to develop, a reality that is occurring now at Lake Mead. Relatively lower water levels at Lake Mead are not alarming nor surprising. It is common for regions throughout the world to experience varying periods of lower or higher rainfall and fluctuating water levels. The water levels at Lake Mead are not representative of what has been occurring throughout America over the past 100 years.
As shown in Figure 1, during the past century, much of the continental United States has enjoyed more abundant precipitation as the planet has warmed.2 Further, the U.N. Intergovernmental Panel on Climate Change (IPCC) has confirmed that since 1951 there has been an increase in precipitation in mid-latitude global regions, including the United States, with no detected global precipitation decline.3 It is also important to note the Lake Mead reservoir serves water to Arizona, California, and Nevada.
Every one of those states has experienced significant population increases and greater water demands since the reservoir was filled in 1935, an important factor when considering Lake Mead’s water levels.4,5
Figure 1. Annual Precipitation Trends in the United States, 1895–2020
Figure 1. This figure shows U.S. precipitation trends during the 1895–2020 period. Note that precipitation has increased throughout much of the United States during the past century as the planet has warmed, contradicting claims made by many climate activists insisting that global warming is causing droughts and severe drops in water levels. Also note that the Western United States, shown in grey in Figure 1, has not experienced a strong trend during the studied period. Source: National Centers for Environmental Information, “United States Precipitation Trends 1895–2020,” National Oceanic and Atmospheric Administration, accessed July 12, 2021, https://www.ncdc.noaa.gov/monitoring-content/temp-and-precip/us-trends/prcp/trends-prcp-ann-por-full.gif.
Ove Hoegh-Guldberg, Daniela Jacob, and Michael Taylor, coordinating lead authors, “Impacts of 1.5°C of Global Warming on Natural and Human Systems,” Chapter 3, Special Report: Global Warming of 1.5 ºC, U.N. Intergovernmental Panel on Climate Change, 2018, p. 191 https://www.ipcc.ch/site/assets/uploads/sites/2/2019/06/SR15_ Chapter3_Low_Res.pdf
Lake Mead water levels rose steadily from 1965 to 1983, setting record-high levels in 1983.
For all but two years of the three decades running from 1973 to 2002, water levels remained above average, the longest such period on record.
After nearly 30 years of abundance, a decline was bound to eventually occur.
Rainfall has been below average in recent years in the Colorado River Basin, but above average nationally.
Some regions of the world are always going to be drier than others, with or without global warming.
Short Summary:
For most of the past half-century, Lake Mead has enjoyed above average water levels.1 Lake Mead water levels rose steadily for 18 years, from 1965 to 1983, and they remained above average for most of the three decade period from 1973 to 2002.
At some point, lower water levels are bound to develop, a reality that is occurring now at Lake Mead. Relatively lower water levels at Lake Mead are not alarming nor surprising. It is common for regions throughout the world to experience varying periods of lower or higher rainfall and fluctuating water levels. The water levels at Lake Mead are not representative of what has been occurring throughout America over the past 100 years.
As shown in Figure 1, during the past century, much of the continental United States has enjoyed more abundant precipitation as the planet has warmed.2 Further, the U.N. Intergovernmental Panel on Climate Change (IPCC) has confirmed that since 1951 there has been an increase in precipitation in mid-latitude global regions, including the United States, with no detected global precipitation decline.3 It is also important to note the Lake Mead reservoir serves water to Arizona, California, and Nevada.
Every one of those states has experienced significant population increases and greater water demands since the reservoir was filled in 1935, an important factor when considering Lake Mead’s water levels.4,5
Figure 1. Annual Precipitation Trends in the United States, 1895–2020
Figure 1. This figure shows U.S. precipitation trends during the 1895–2020 period. Note that precipitation has increased throughout much of the United States during the past century as the planet has warmed, contradicting claims made by many climate activists insisting that global warming is causing droughts and severe drops in water levels. Also note that the Western United States, shown in grey in Figure 1, has not experienced a strong trend during the studied period. Source: National Centers for Environmental Information, “United States Precipitation Trends 1895–2020,” National Oceanic and Atmospheric Administration, accessed July 12, 2021, https://www.ncdc.noaa.gov/monitoring-content/temp-and-precip/us-trends/prcp/trends-prcp-ann-por-full.gif.
Ove Hoegh-Guldberg, Daniela Jacob, and Michael Taylor, coordinating lead authors, “Impacts of 1.5°C of Global Warming on Natural and Human Systems,” Chapter 3, Special Report: Global Warming of 1.5 ºC, U.N. Intergovernmental Panel on Climate Change, 2018, p. 191 https://www.ipcc.ch/site/assets/uploads/sites/2/2019/06/SR15_ Chapter3_Low_Res.pdf
We use cookies to ensure that we give you the best experience on our website. If you continue to use this site we will assume that you are happy with it.
