There has been no significant warming in the United States since at least 2005.
Any claimed recent warming at specific locations in the United States is isolated and indicative of natural variation and urbanization rather than a broad long-term warming trend.
The United States has experienced no significant warming since at least 2005. The lack of warming is documented by the National Oceanic and Atmospheric Administration’s U.S. Climate Reference Network (USCRN), an extremely accurate network of temperature stations located throughout the United States. Unlike other temperature data, USCRN data does not require corrective adjustments to account for factors that may compromise the accuracy of recorded temperatures.
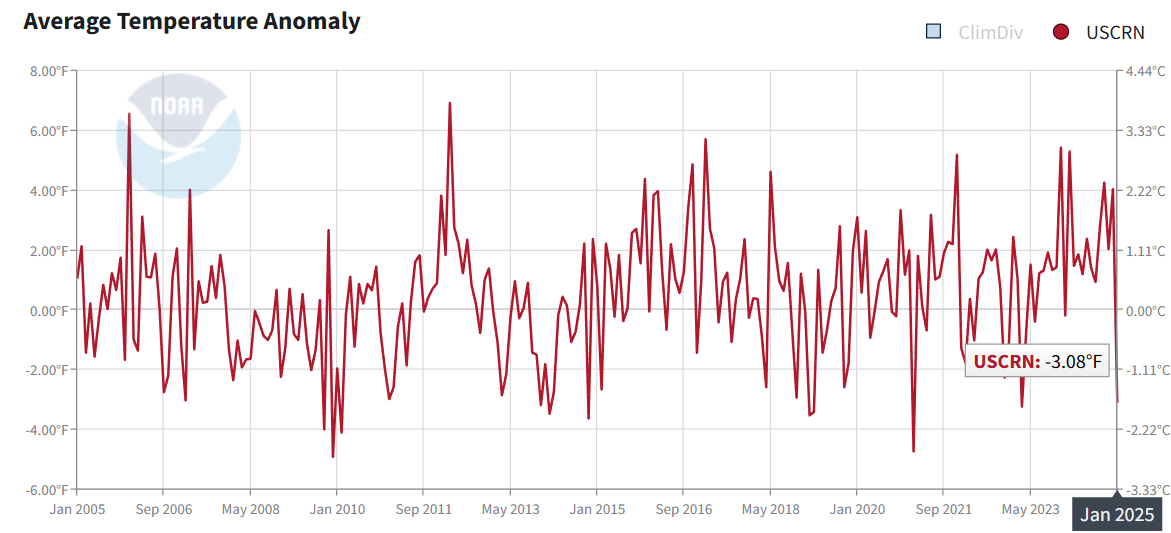
Figure 1 illustrates there has been no significant increase in the number of temperature anomalies since the start of 2005.1,2 Thus, when climate activists have claimed in recent years that warming has caused various U.S. environmental problems, their assessments cannot be accurate, unless they can show that USCRN data are wrong. To date, no credible scientific agency has claimed the USCRN data are inaccurate.
Figure 1. Contiguous U.S. Average Temperature Anomalies
Figure 1. Average surface temperature anomalies in the United States, January 2005 to January 2025. Source: U.S. Climate Reference Network, ncei.noaa.gov, National Climatic Data Center, National Oceanic and Atmospheric Administration.
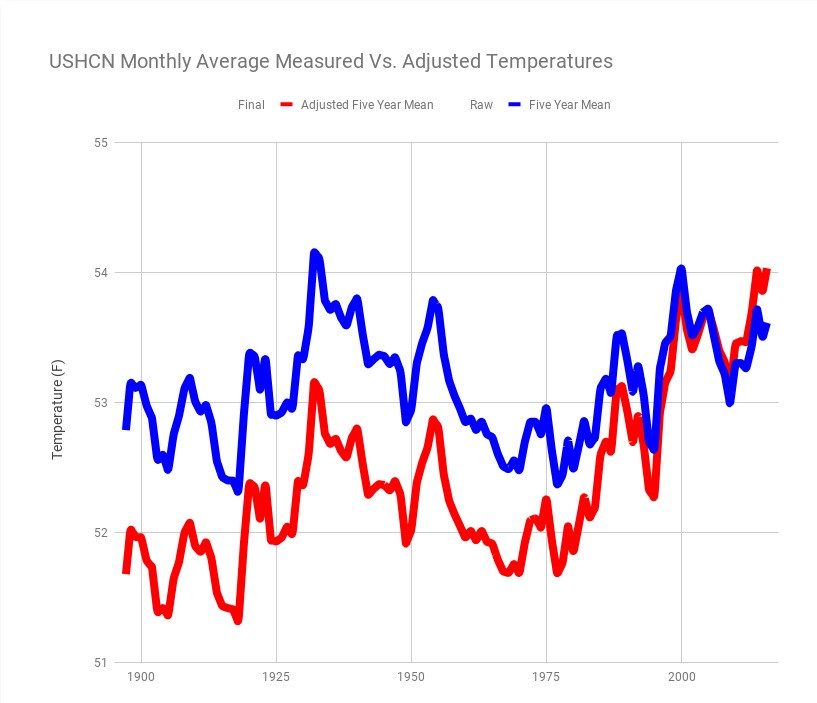
Further, long-term warming in the United States has been modest, at worst. Thermometer readings report current temperatures are no higher today than they were 80 years ago, a reality that has been masked in large part by government agencies that have chosen to adjust temperatures from past decades downward, making it appear as though recent temperatures are comparably much higher than the unadjusted data suggest. (See Figure 2.)
Figure 2. USHN Monthly Measured vs. Adjusted Temperatures
Figure 2: (click to enlarge)U.S. Historical Climatology Network (USHCN) data. The blue line represents unadjusted thermometer readings, which show temperatures are no higher now than they were 80 years ago. Source: Tony Heller, “61% Of NOAA USHCN Adjusted Temperature Data Is Now Fake,” realclimatescience.com, February 11, 2019: https://realclimatescience.com/2019/02/61-of-noaa-ushcn-adjusted-temperature-data-is-now-fake
The poor placement of temperature stations that are not part of the Climate Reference Network is another factor biasing temperature data upward. Many stations are affected by urbanization, resulting in temperature inaccuracies.3, 4, 5
The raw, unadjusted data, shown in Figure 2, clearly illustrates recent temperatures are likely the same or nearly the same as they were in the 1930s, and perhaps even lower.6
References:
U.S. Climate Reference Network, National Oceanic and Atmospheric Administration’s (NOAA) National Centers for Environmental Information, accessed August 17, 2021, https://www.ncdc.noaa.gov/crn
There has been no significant warming in the United States since at least 2005.
Any claimed recent warming at specific locations in the United States is isolated and indicative of natural variation and urbanization rather than a broad long-term warming trend.
The United States has experienced no significant warming since at least 2005. The lack of warming is documented by the National Oceanic and Atmospheric Administration’s U.S. Climate Reference Network (USCRN), an extremely accurate network of temperature stations located throughout the United States. Unlike other temperature data, USCRN data does not require corrective adjustments to account for factors that may compromise the accuracy of recorded temperatures.
Figure 1 illustrates there has been no significant increase in the number of temperature anomalies since the start of 2005.1,2 Thus, when climate activists have claimed in recent years that warming has caused various U.S. environmental problems, their assessments cannot be accurate, unless they can show that USCRN data are wrong. To date, no credible scientific agency has claimed the USCRN data are inaccurate.
Figure 1. Contiguous U.S. Average Temperature Anomalies
Figure 1. Average surface temperature anomalies in the United States, January 2005 to January 2025. Source: U.S. Climate Reference Network, ncei.noaa.gov, National Climatic Data Center, National Oceanic and Atmospheric Administration.
Further, long-term warming in the United States has been modest, at worst. Thermometer readings report current temperatures are no higher today than they were 80 years ago, a reality that has been masked in large part by government agencies that have chosen to adjust temperatures from past decades downward, making it appear as though recent temperatures are comparably much higher than the unadjusted data suggest. (See Figure 2.)
Figure 2. USHN Monthly Measured vs. Adjusted Temperatures
Figure 2: (click to enlarge)U.S. Historical Climatology Network (USHCN) data. The blue line represents unadjusted thermometer readings, which show temperatures are no higher now than they were 80 years ago. Source: Tony Heller, “61% Of NOAA USHCN Adjusted Temperature Data Is Now Fake,” realclimatescience.com, February 11, 2019: https://realclimatescience.com/2019/02/61-of-noaa-ushcn-adjusted-temperature-data-is-now-fake
The poor placement of temperature stations that are not part of the Climate Reference Network is another factor biasing temperature data upward. Many stations are affected by urbanization, resulting in temperature inaccuracies.3, 4, 5
The raw, unadjusted data, shown in Figure 2, clearly illustrates recent temperatures are likely the same or nearly the same as they were in the 1930s, and perhaps even lower.6
References:
U.S. Climate Reference Network, National Oceanic and Atmospheric Administration’s (NOAA) National Centers for Environmental Information, accessed August 17, 2021, https://www.ncdc.noaa.gov/crn
We use cookies to ensure that we give you the best experience on our website. If you continue to use this site we will assume that you are happy with it.