NASA satellite instruments, with readings dating back to 1993, show global sea level rising at a pace of merely 1.2 inches per decade.
Isolated locations with more accelerated sea level rise reflect local conditions, such as tectonic plate movement and withdrawing underground freshwater reserves, rather than climate change.
Human civilization successfully dealt with sea level rise utilizing nineteenth and twentieth century technologies, and it will be able to adapt to rising sea levels even more successfully in the coming decades by utilizing twenty-first century technologies.
Short Summary:
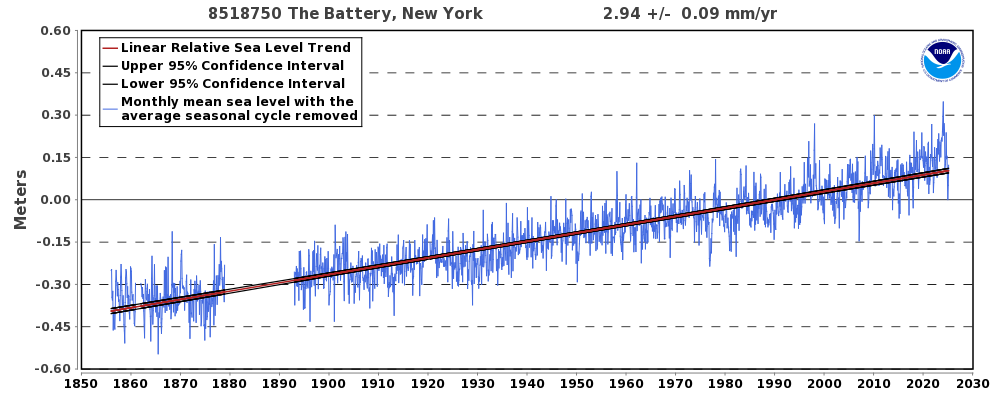
Global sea level has risen more than 400 feet since the end of the last ice age glaciation. Global sea levels have been rising at a relatively steady pace of approximately 1 foot per century since at least the mid-1800s.1 One of the oldest tide-gauge records of sea level, New York City’s “Battery,” shows a linear trend of 2.88 mm per year (0.113 inches per year) since 1856, with very little, if any, recent acceleration.2 (See Figure 1.)
Figure 1: Tidal Gauge Readings at the Battery, New York
Figure 1: (click to enlarge)Tidal gauge measurements at the Battery in New York City illustrate there has been a steady, modest pace of sea level rise of just less than 1 inch per decade. This rate of sea level rise goes back more than a century. Source: National Oceanic and Atmospheric Administration: https://tidesandcurrents.noaa.gov/sltrends/sltrends_station.shtml?id=8518750.
A smaller dataset of satellite data going back to 1993 also shows little, if any, acceleration in the pace of sea-level rise.3
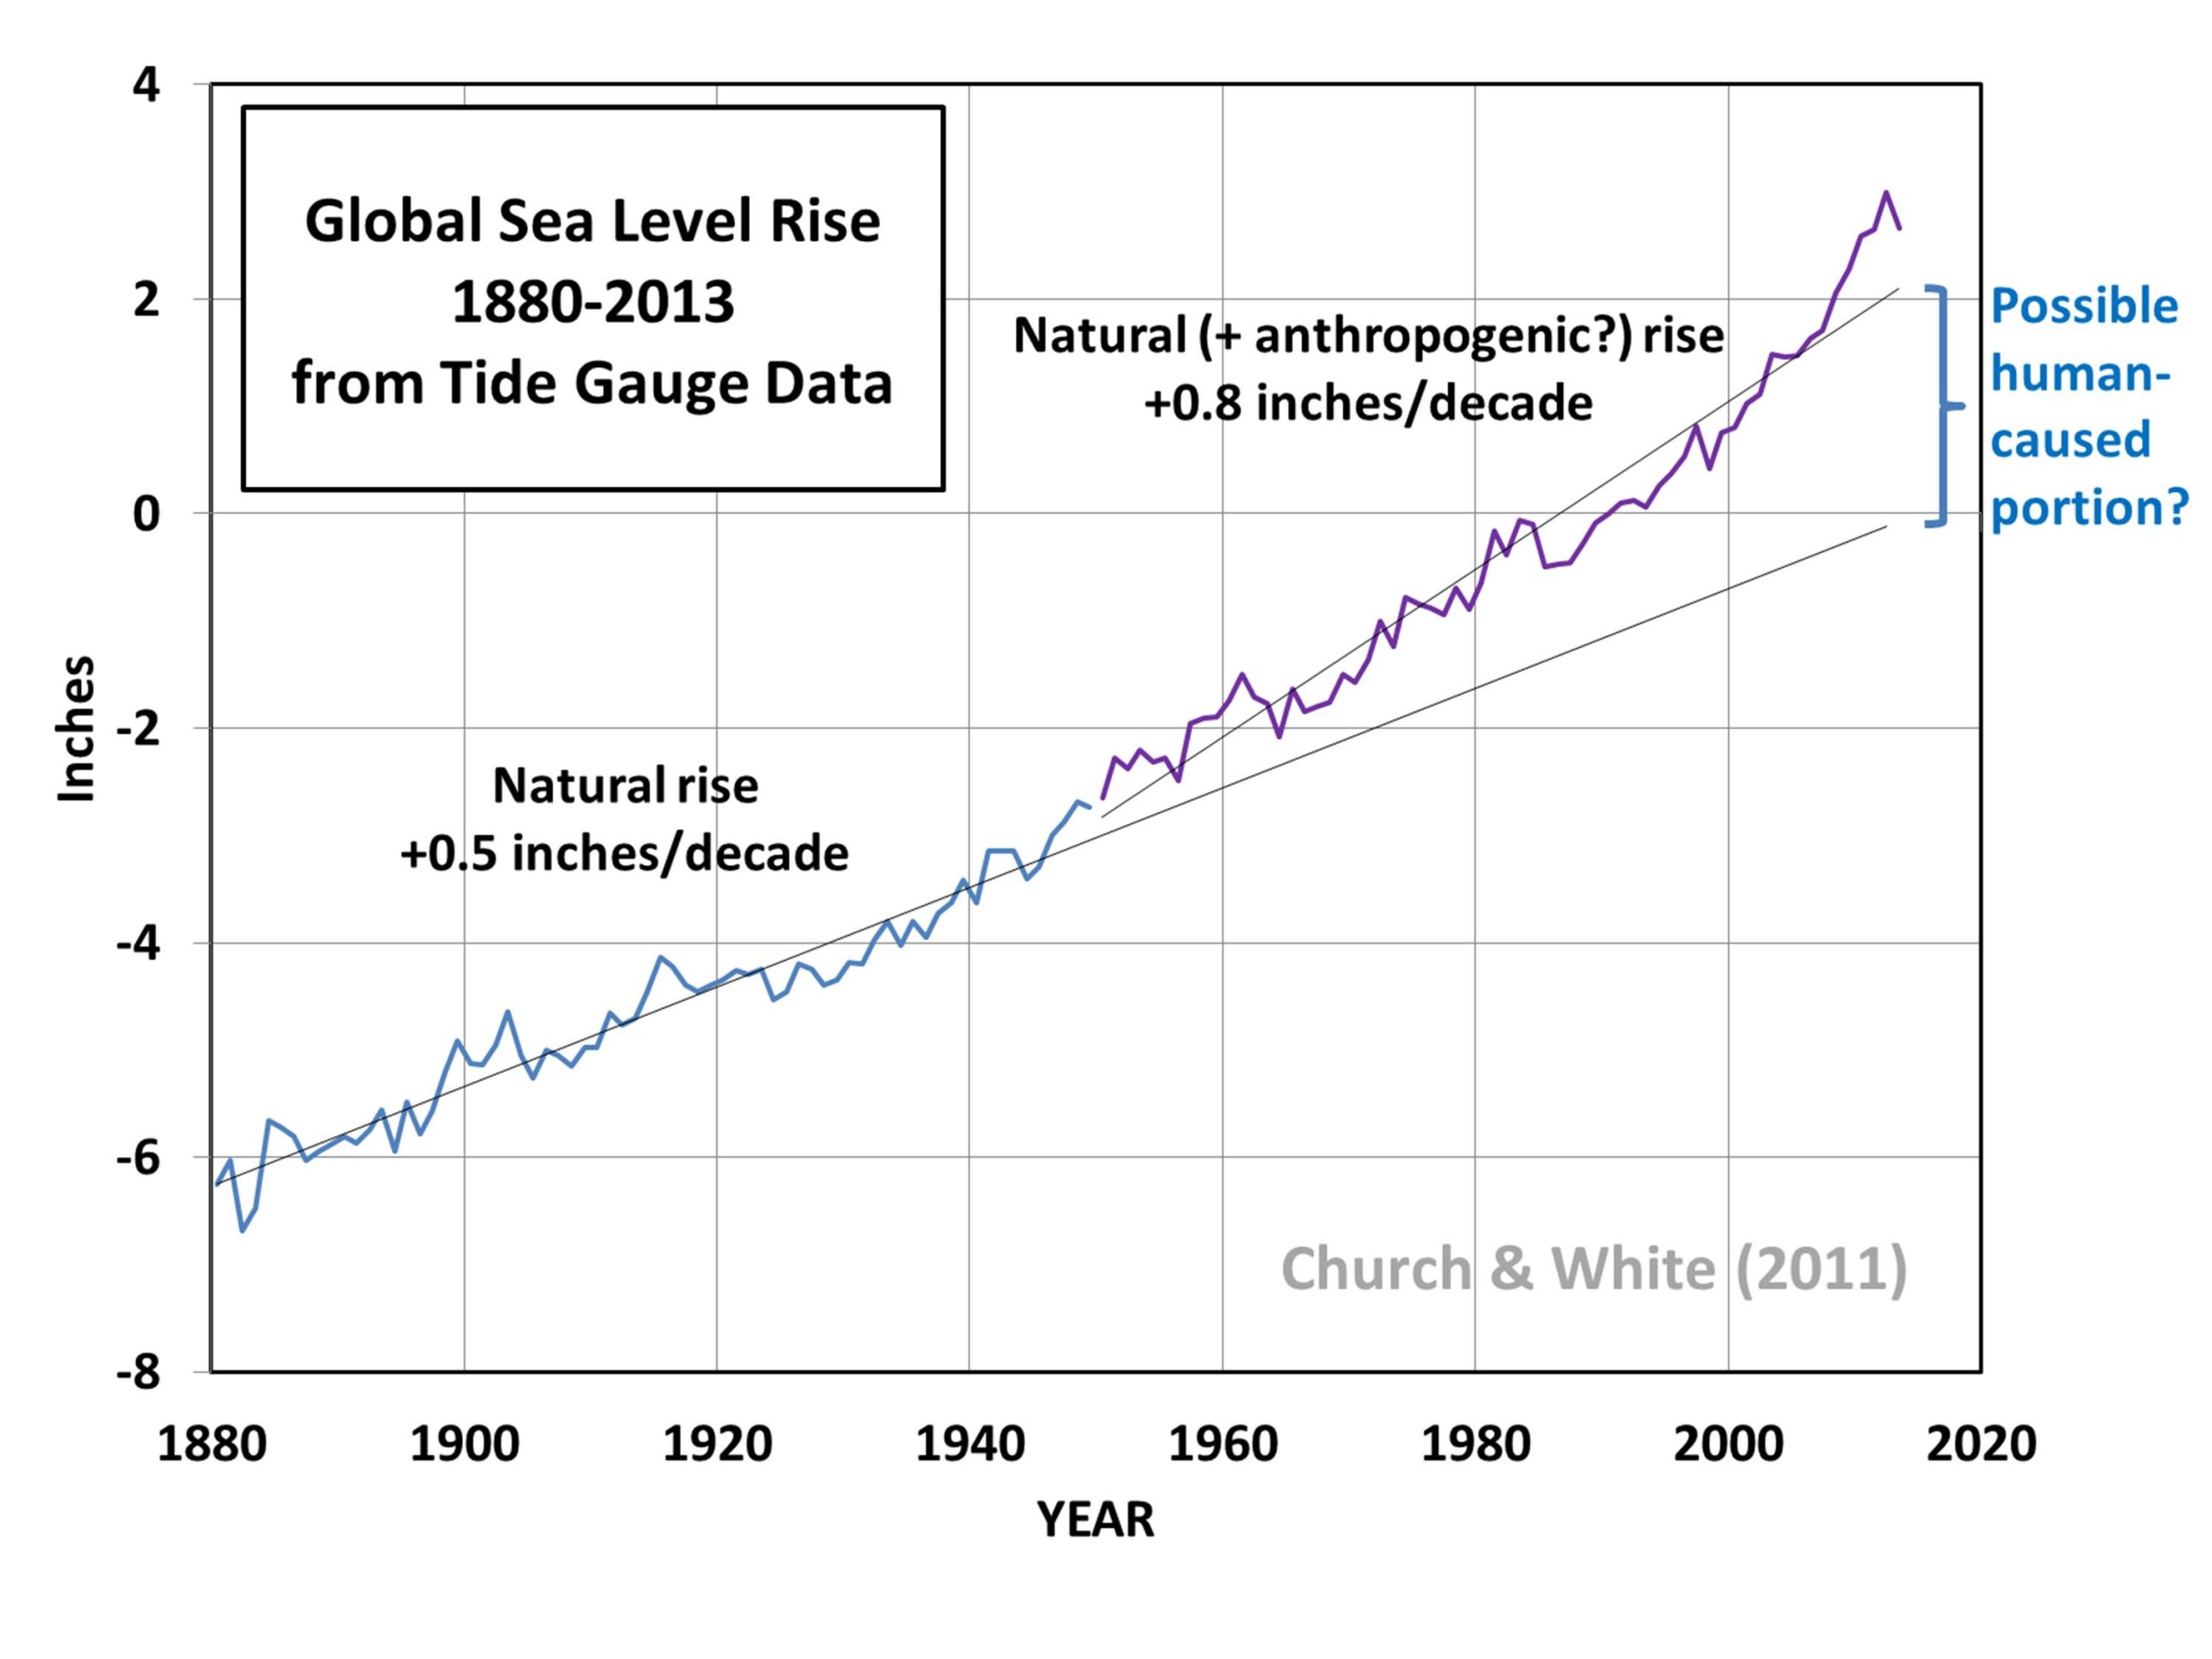
Perhaps most importantly, an independent analysis of tide-gauge data, which has a much longer record compared to satellite data, found humans have likely had only a very modest impact on long-term sea-level rise. Climatologist Roy Spencer performed the analysis, which is illustrated in Figure 2.
Spencer’s analysis suggests humans’ contribution to sea-level rise could be as little as three-tenths of an inch per decade, or about three inches per century. Natural sea-level rise accounts for half an inch of sea-level rise per decade, or 5 inches per century.4
Combined, the rate of sea-level rise is eight-tenths of an inch per decade, or 8 inches per century, which is even slower than what satellite instruments report.
Figure 2. Global Sea-Level Rise, 1880–2013, from Tide-Gauge Data
Figure 2. This figure shows sea-level rise dating back to 1880. Graph by Roy Spencer, Ph.D. For a more detailed analysis, see Spencer’s article, which can be found in Note 4 in the References section below.
Sea Level Research Group, “Global Mean Sea Level (Seasonal Signals Removed),” University of Colorado, sealevel.colorado.edu, last accessed August 15, 2021, http://sealevel.colorado.edu
Climate At A Glance is a Project of The Heartland Institute View this page in our printable booklet (PDF) here. Email: think@heartland.org Photo: Chris Schippers. New York City, Manhattan. Image licensed from pexels.com.
NASA satellite instruments, with readings dating back to 1993, show global sea level rising at a pace of merely 1.2 inches per decade.
Isolated locations with more accelerated sea level rise reflect local conditions, such as tectonic plate movement and withdrawing underground freshwater reserves, rather than climate change.
Human civilization successfully dealt with sea level rise utilizing nineteenth and twentieth century technologies, and it will be able to adapt to rising sea levels even more successfully in the coming decades by utilizing twenty-first century technologies.
Short Summary:
Global sea level has risen more than 400 feet since the end of the last ice age glaciation. Global sea levels have been rising at a relatively steady pace of approximately 1 foot per century since at least the mid-1800s.1 One of the oldest tide-gauge records of sea level, New York City’s “Battery,” shows a linear trend of 2.88 mm per year (0.113 inches per year) since 1856, with very little, if any, recent acceleration.2 (See Figure 1.)
Figure 1: Tidal Gauge Readings at the Battery, New York
Figure 1: (click to enlarge)Tidal gauge measurements at the Battery in New York City illustrate there has been a steady, modest pace of sea level rise of just less than 1 inch per decade. This rate of sea level rise goes back more than a century. Source: National Oceanic and Atmospheric Administration: https://tidesandcurrents.noaa.gov/sltrends/sltrends_station.shtml?id=8518750.
A smaller dataset of satellite data going back to 1993 also shows little, if any, acceleration in the pace of sea-level rise.3
Perhaps most importantly, an independent analysis of tide-gauge data, which has a much longer record compared to satellite data, found humans have likely had only a very modest impact on long-term sea-level rise. Climatologist Roy Spencer performed the analysis, which is illustrated in Figure 2.
Spencer’s analysis suggests humans’ contribution to sea-level rise could be as little as three-tenths of an inch per decade, or about three inches per century. Natural sea-level rise accounts for half an inch of sea-level rise per decade, or 5 inches per century.4
Combined, the rate of sea-level rise is eight-tenths of an inch per decade, or 8 inches per century, which is even slower than what satellite instruments report.
Figure 2. Global Sea-Level Rise, 1880–2013, from Tide-Gauge Data
Figure 2. This figure shows sea-level rise dating back to 1880. Graph by Roy Spencer, Ph.D. For a more detailed analysis, see Spencer’s article, which can be found in Note 4 in the References section below.
Sea Level Research Group, “Global Mean Sea Level (Seasonal Signals Removed),” University of Colorado, sealevel.colorado.edu, last accessed August 15, 2021, http://sealevel.colorado.edu
Climate At A Glance is a Project of The Heartland Institute View this page in our printable booklet (PDF) here. Email: think@heartland.org Photo: Chris Schippers. New York City, Manhattan. Image licensed from pexels.com.
We use cookies to ensure that we give you the best experience on our website. If you continue to use this site we will assume that you are happy with it.