The number of “very hot” days has not increased over time, though the number of “very cold” days has declined modestly.
The number and extent of wildfires have not increased.
Crop production has increased across the board over the past century, particularly important crops like wheat and barley.
Average temperatures in Montana have risen modestly since 1900, some of that rise can be attributed to urban heat island effect.
Short Summary:
Temperature Trends:
Montana has a variety of climate zones, but most of the state is cold semi-arid, and warm-summer continental, meaning cold winters and somewhat humid warm summers.1 Some parts of the state, particularly towards the west and Rocky Mountains, meet the criteria for a sub-arctic climate. This means Montana is prone to extreme winter conditions.
Overall, average temperatures in Montana have increased by around 2.5°F since the start of the 20th century.2 However, this trend is not reflected in the observed number of “very hot” days (days with temperatures of 95°F and above) or the number of warm nights (nights with minimum temperatures of 70°F and above.) Higher average temperatures appear to be influenced by the decrease in the number of very cold nights (max temperature of 0°F or lower), and because average winter and summer temperatures have very modestly increased since 1900.3 It is also important to note that new research suggests that the urban heat island effect is likely to have influenced warming trends particularly in urban and suburban areas, where about 65 percent of the observed warming can be attributed to urbanization.4
Montana’s record-high temperature of 117°F was set in 1893, 131 years of global warming ago, and a record tied in 1937, nearly ninety years of global warming in the past.5
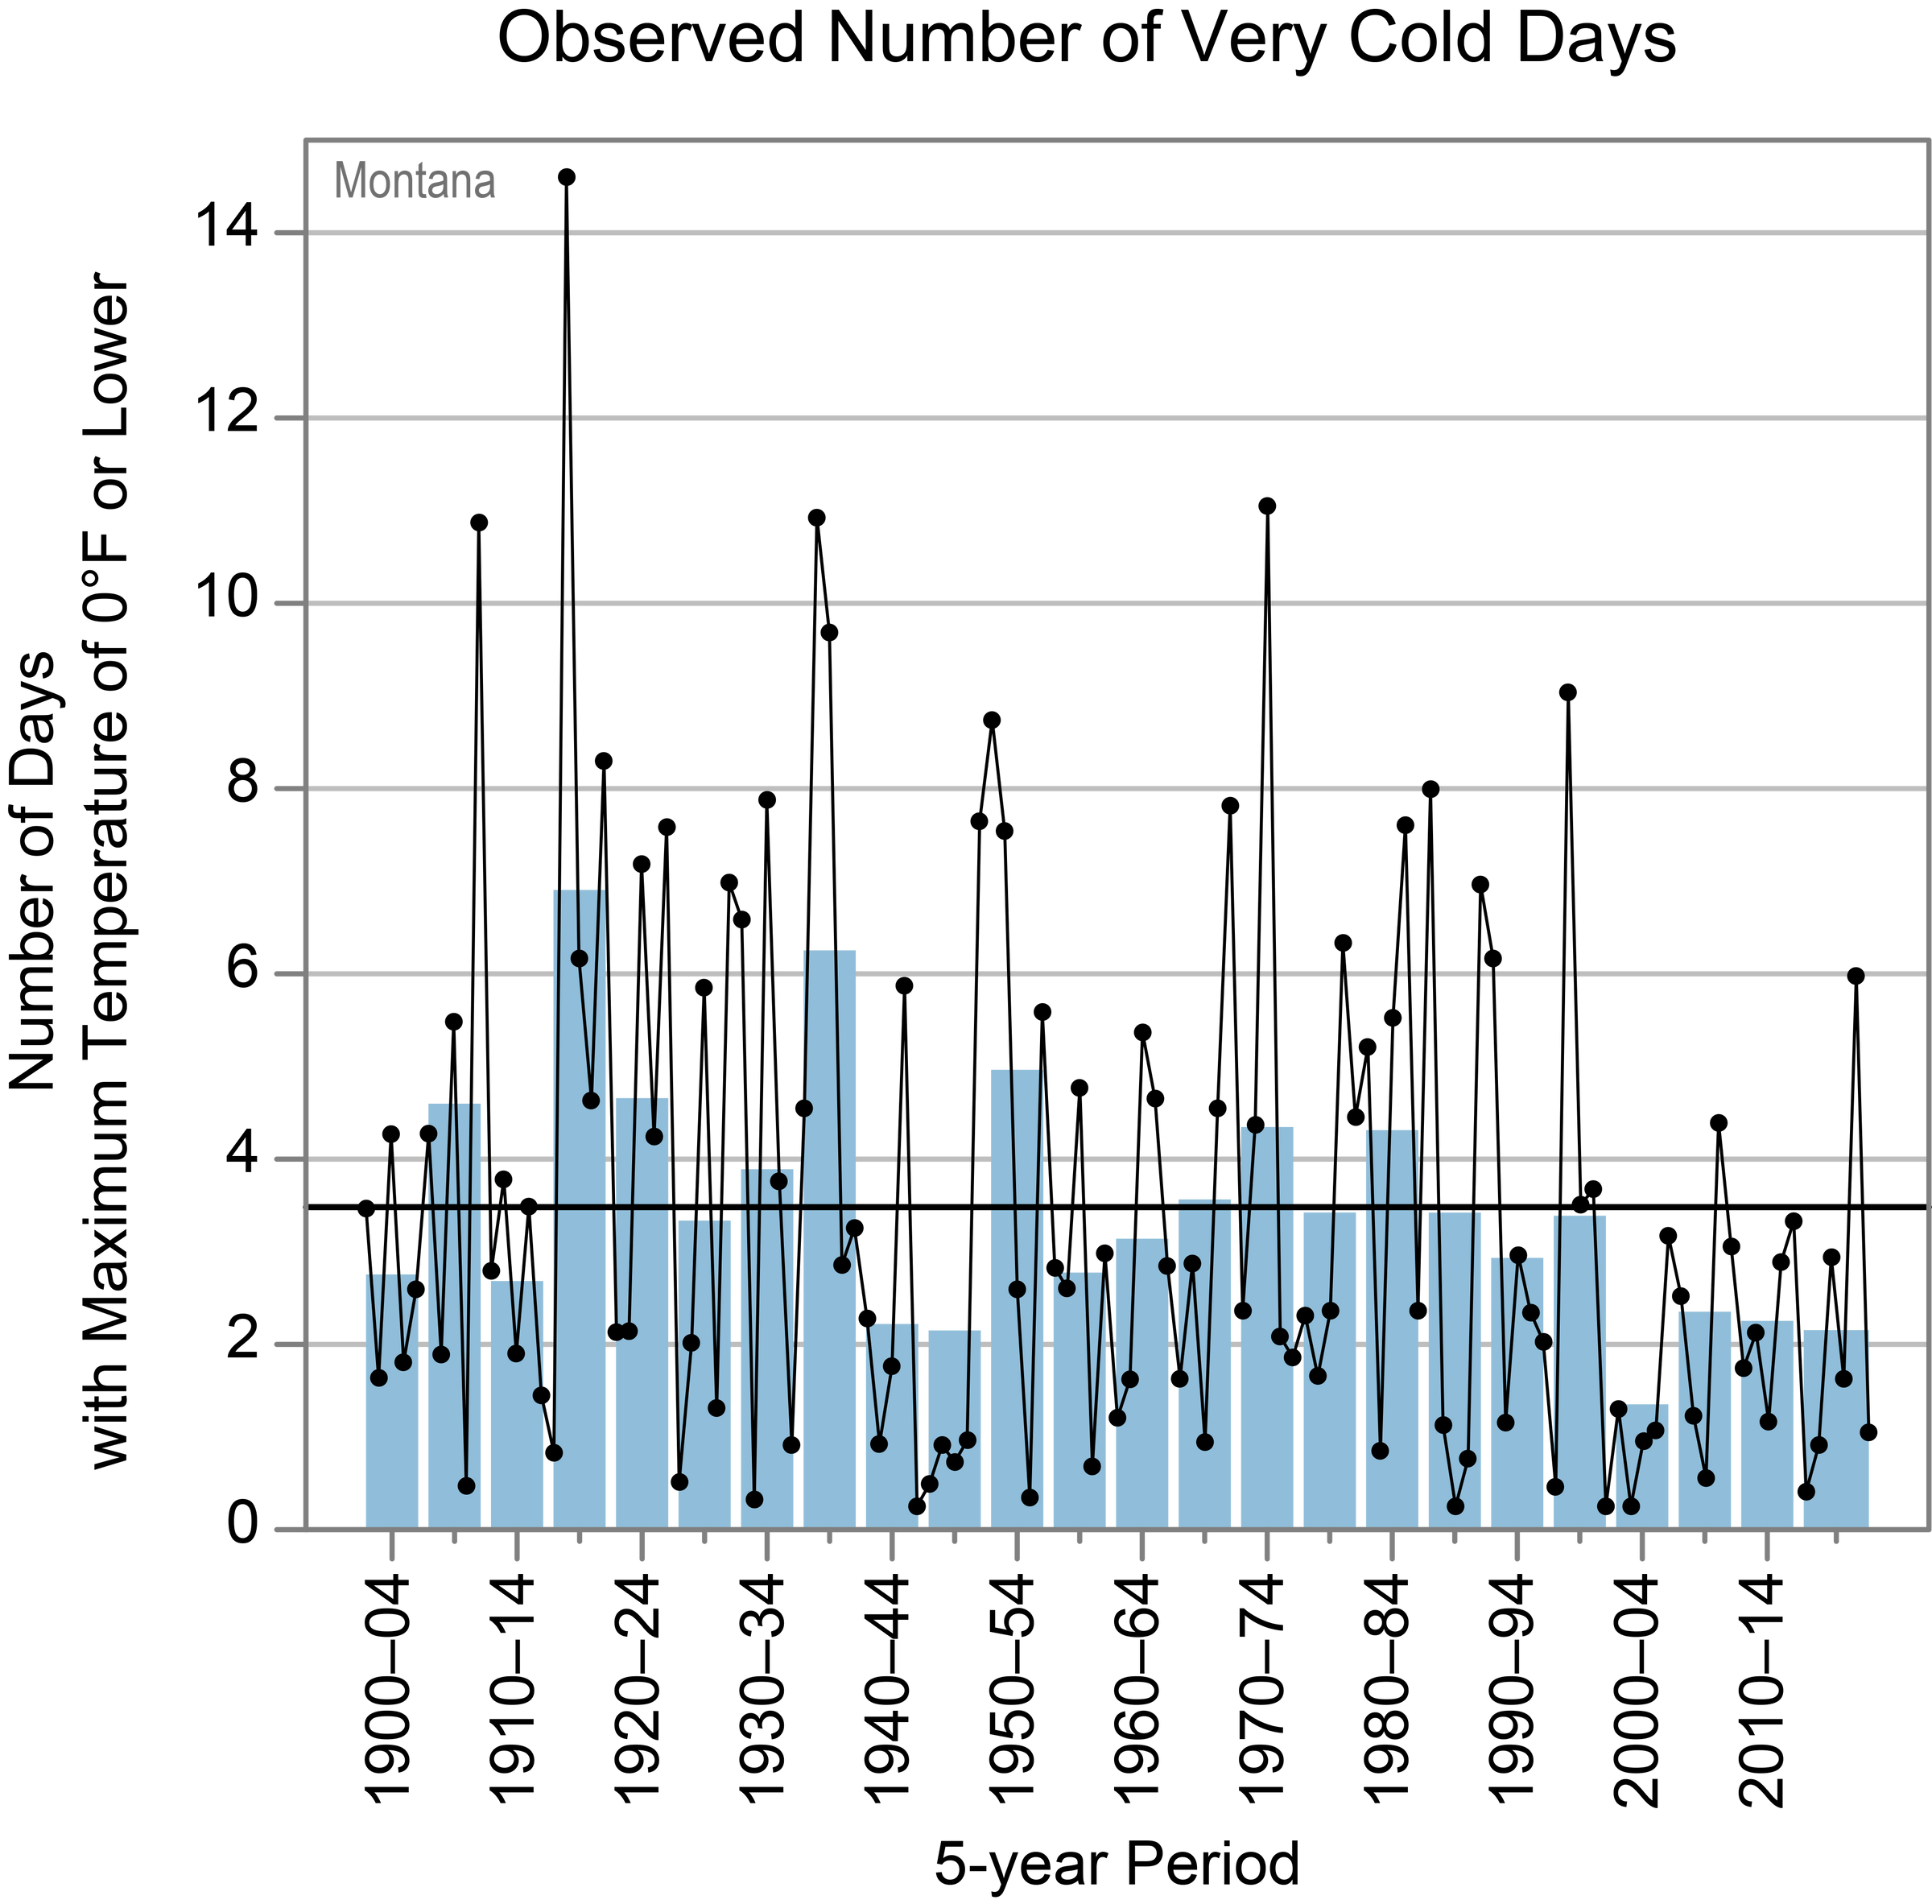
Figure 1: Observed number of very cold days since 1900. Dots are annual values. Blue bars show averages over a 5-year period, though the last bar is a 6-year average. The horizontal black line shows the average of the entire period. Chart from Rebekah Frankson and Kenneth E. Kunkel, State Climate Summaries 2022: Montana, National Centers for Environmental Information.
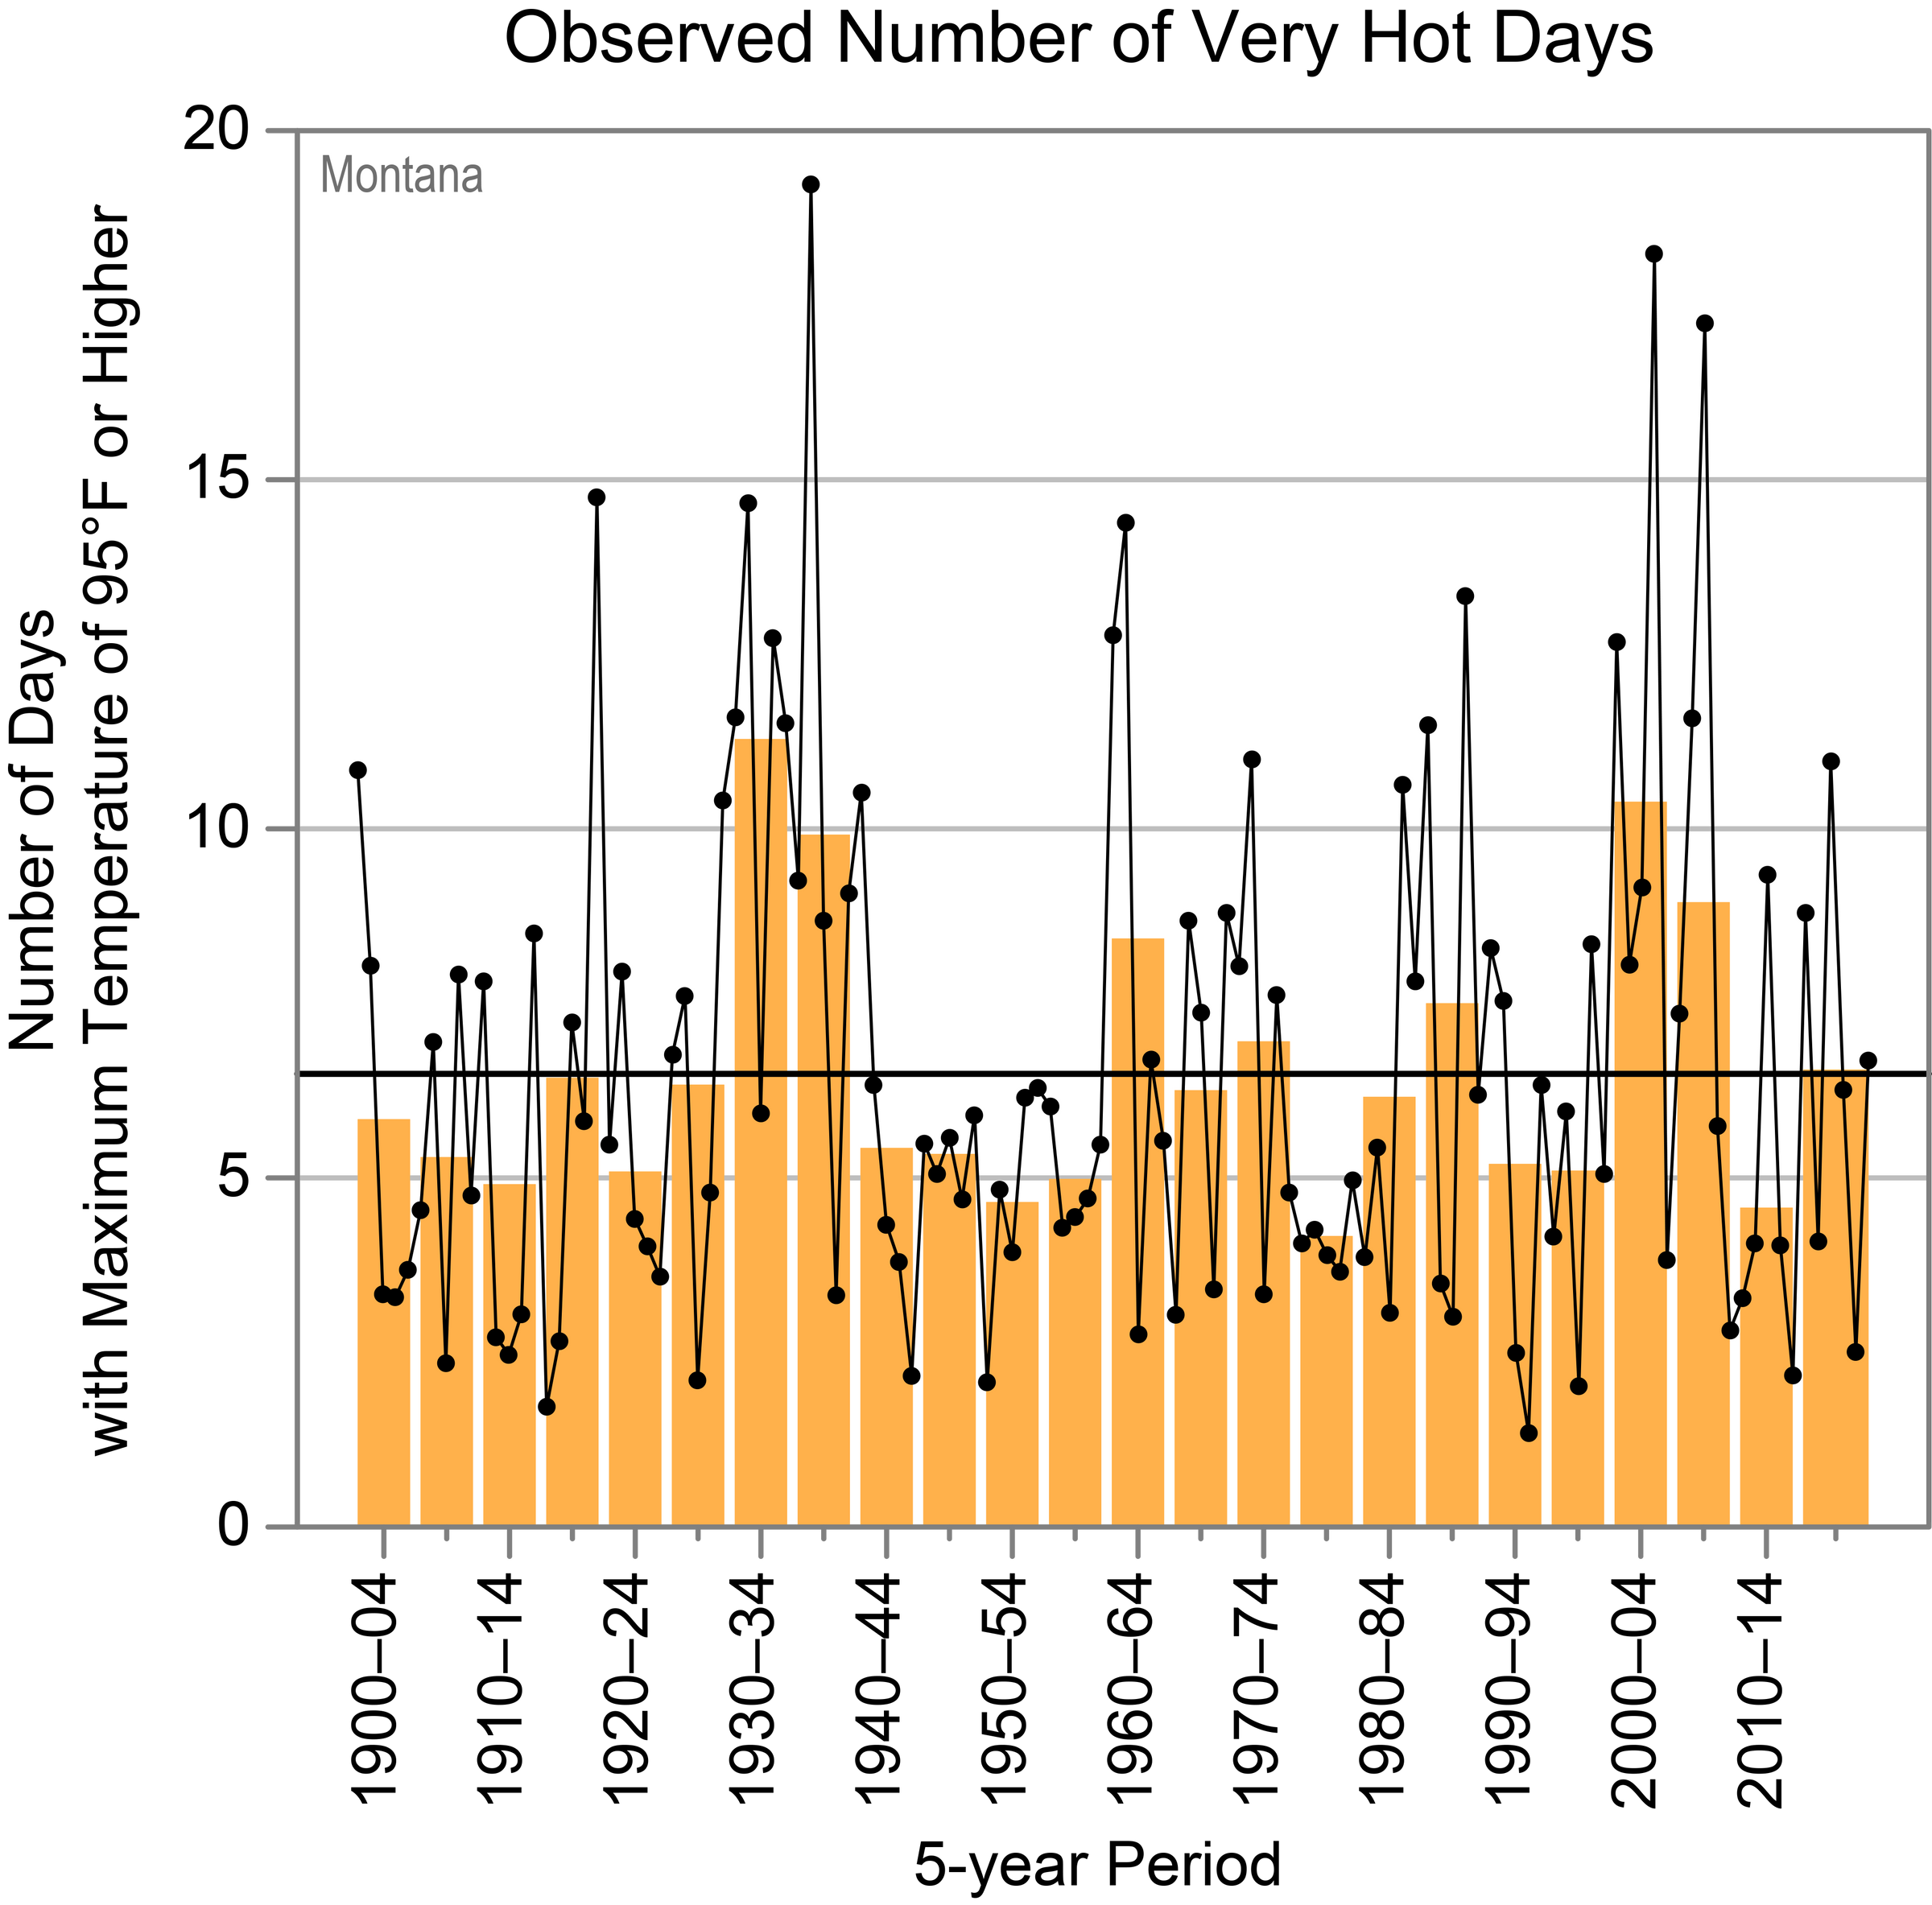
Figure 2: Observed number of very hot days since 1900. Dots are annual values. Orange bars show averages over a 5-year period, the last bar is a 6-year average. The horizontal black line shows the average of the entire period. Chart from Rebekah Frankson and Kenneth E. Kunkel, State Climate Summaries 2022: Montana, National Centers for Environmental Information.
Precipitation:
Due to the Rocky Mountains, Montana has different expectations for precipitation between the mountains, which get a lot of snow in winter, and the eastern plains, which are very dry in comparison. On average, annual precipitation sees large swings from one year to the next in the state, but there is no overall trend since 1900.6 Likewise, drought shows no trend of becoming more frequent or intense in the state.7
State-Specific Issues:
Montana is prone to wildfires, especially grass fires that burn large swaths of grassland and can be dangerous to homes, other structures, and even cattle. There is no statistically significant trend in the number of wildfires or acres burned in Montana since records began in 2006.8
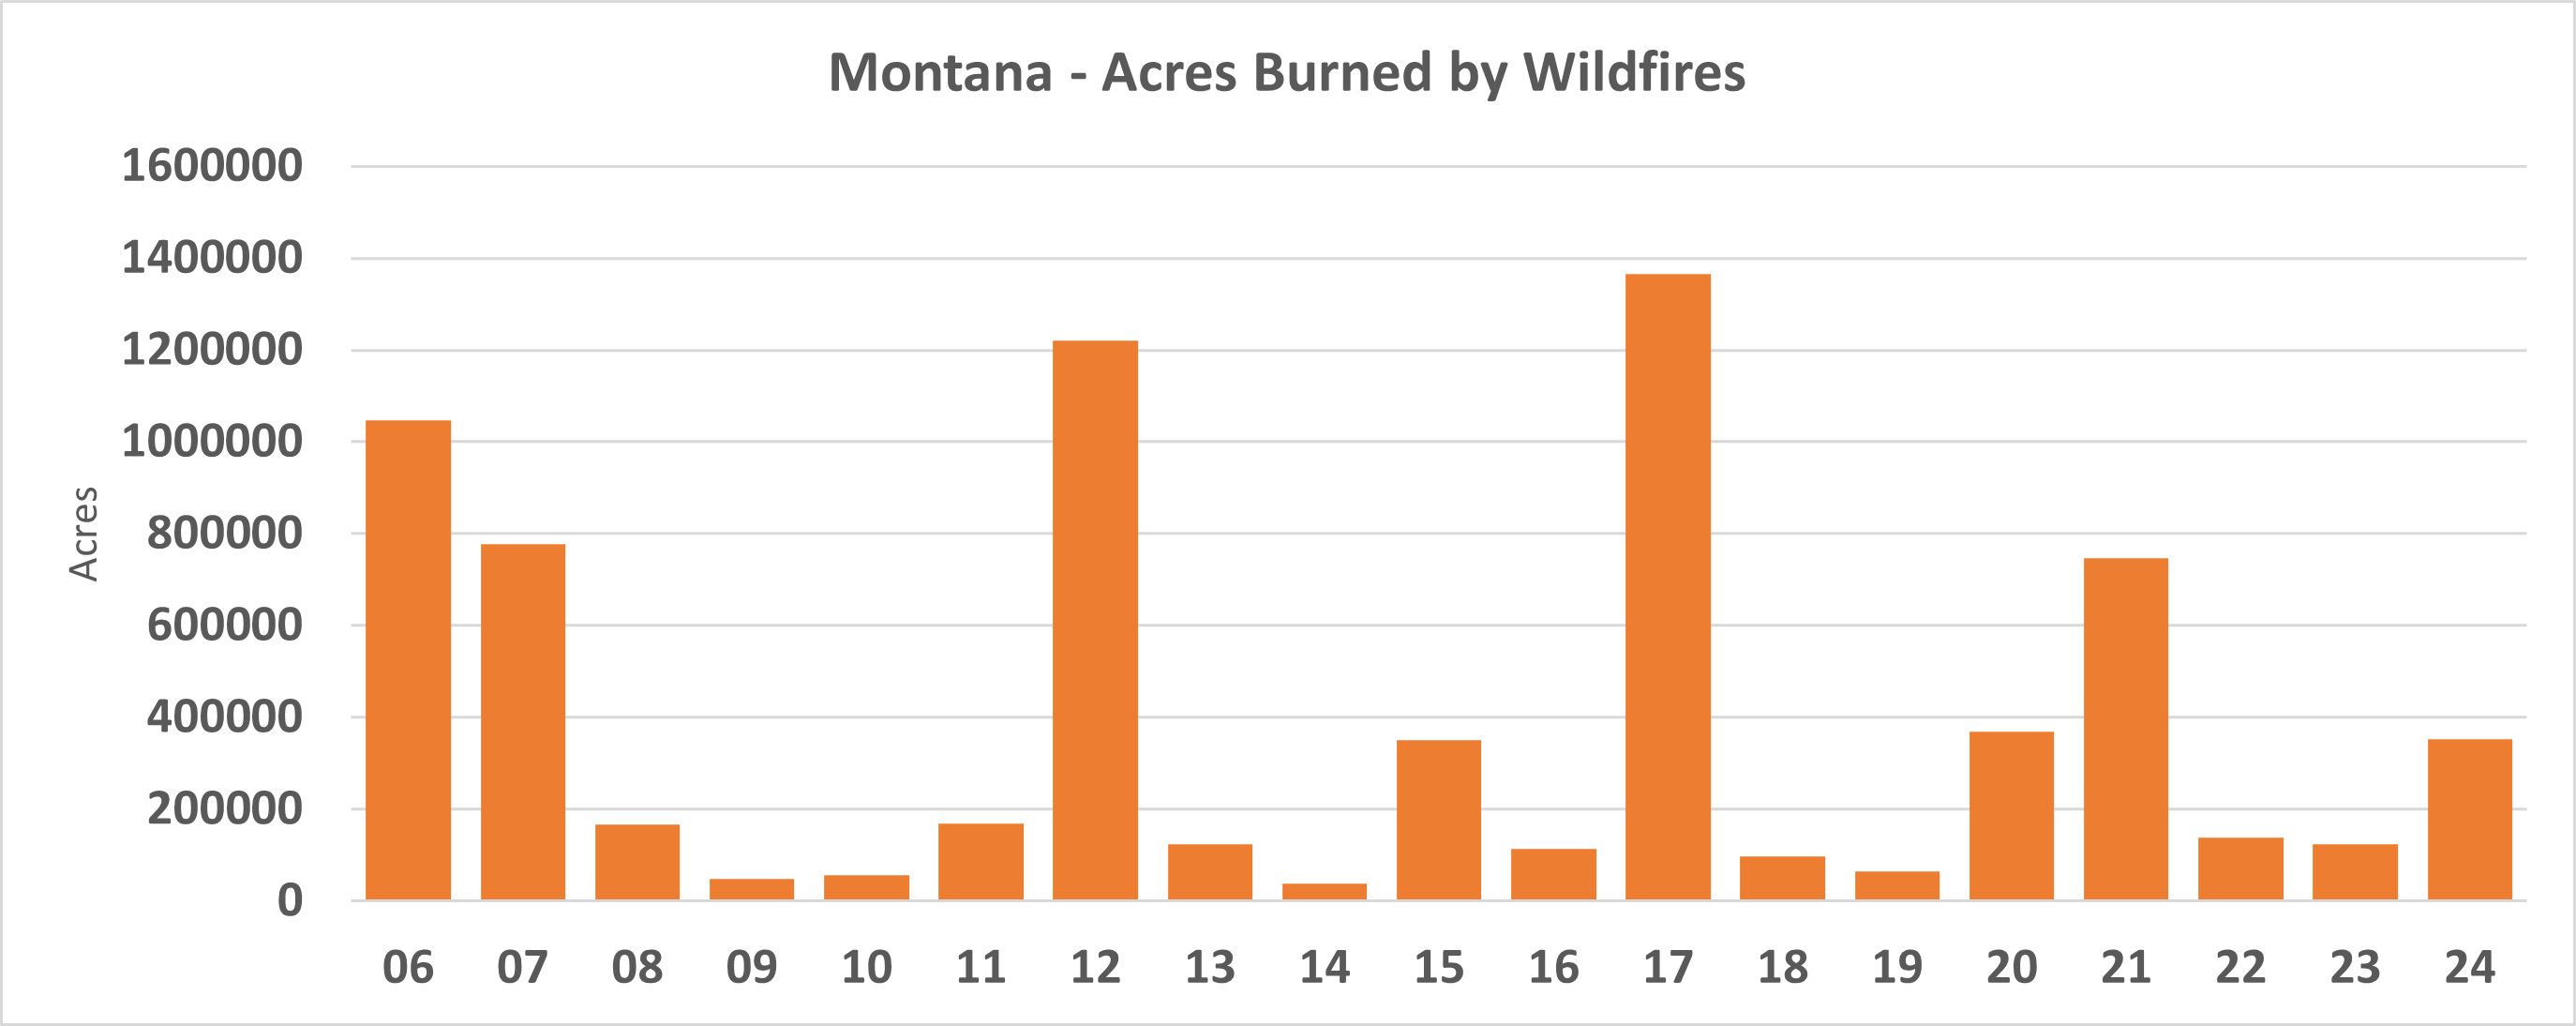
Figure 3: Acres burned by wildfires in Montana since 2006, data from National Interagency Fire Center.
Figure 4: Number of wildfires in Montana since 2006, data from National Interagency Fire Center.
Montana is also prone to severe winter conditions like blizzards, especially in the western part of the state. The current record for snowfall in a single day occurred in 2006, with 51.8 inches of snow in Lewis and Clark County.9
Agriculture:
The Montana Department of Agriculture reports that cattle and wheat are the state’s biggest commodities, along with sugar beets, hay, and barley.10
Since 1988, cattle production (pounds) has remained relatively stable, rising 6 percent by 2023.11
From 1900 to 2024, wheat production (bushels) increased by an amazing 7,905 percent.12 Sugar beet production (tons) increased 130 percent between 1928 and 2024.13 Hay production (tons) increased 185 percent between 1909 and 2024,14 and barley production (bushels) increased by 5,740 percent from 1900 to 2024.15
Conclusion
All the above data considered, there is no evidence Montana is suffering due to the modest warming over the past hundred-plus years. While warming has occurred, heat extremes have not worsened, deadly cold extremes have declined, precipitation conditions remain about the same, and crop production increased markedly.
References:
“United States Koppen-Geiger Climate Classification Map.” plantmaps.com, January 20, 2024. https://www.plantmaps.com/koppen-climate-classification-map-united-states.php#google_vignette.
Rebekah Frankson and Kenneth E. Kunkel, State Climate Summaries 2022: Montana, National Centers for Environmental Information. Accessed April 16, 2025 https://statesummaries.ncics.org/chapter/mt/
Ibid.
Spencer, Roy W., John R. Christy, and William D. Braswell. “Urban Heat Island Effects in U.S. Summer Surface Temperature Data, 1895–2023”, Journal of Applied Meteorology and Climatology (published online ahead of print 2025), doi: https://doi.org/10.1175/JAMC-D-23-0199.1
See the most extreme temperatures in Montana history. Stacker. (2022, April 11). https://stacker.com/stories/montana/see-most-extreme-temperatures-montana-history
Rebekah Frankson and Kenneth E. Kunkel, State Climate Summaries 2022: Montana, National Centers for Environmental Information. Accessed April 16, 2025 https://statesummaries.ncics.org/chapter/mt/
National Interagency Coordination Center, NICC Annual Reports, accessed April 2025, https://www.nifc.gov/nicc/predictive-services/intelligence
“Snowfall Extremes.” National Centers for Environmental Information (NCEI), April 2025. https://www.ncei.noaa.gov/access/monitoring/snowfall-extremes/MT/1..
The number of “very hot” days has not increased over time, though the number of “very cold” days has declined modestly.
The number and extent of wildfires have not increased.
Crop production has increased across the board over the past century, particularly important crops like wheat and barley.
Average temperatures in Montana have risen modestly since 1900, some of that rise can be attributed to urban heat island effect.
Short Summary:
Temperature Trends:
Montana has a variety of climate zones, but most of the state is cold semi-arid, and warm-summer continental, meaning cold winters and somewhat humid warm summers.1 Some parts of the state, particularly towards the west and Rocky Mountains, meet the criteria for a sub-arctic climate. This means Montana is prone to extreme winter conditions.
Overall, average temperatures in Montana have increased by around 2.5°F since the start of the 20th century.2 However, this trend is not reflected in the observed number of “very hot” days (days with temperatures of 95°F and above) or the number of warm nights (nights with minimum temperatures of 70°F and above.) Higher average temperatures appear to be influenced by the decrease in the number of very cold nights (max temperature of 0°F or lower), and because average winter and summer temperatures have very modestly increased since 1900.3 It is also important to note that new research suggests that the urban heat island effect is likely to have influenced warming trends particularly in urban and suburban areas, where about 65 percent of the observed warming can be attributed to urbanization.4
Montana’s record-high temperature of 117°F was set in 1893, 131 years of global warming ago, and a record tied in 1937, nearly ninety years of global warming in the past.5
Figure 1: Observed number of very cold days since 1900. Dots are annual values. Blue bars show averages over a 5-year period, though the last bar is a 6-year average. The horizontal black line shows the average of the entire period. Chart from Rebekah Frankson and Kenneth E. Kunkel, State Climate Summaries 2022: Montana, National Centers for Environmental Information.
Figure 2: Observed number of very hot days since 1900. Dots are annual values. Orange bars show averages over a 5-year period, the last bar is a 6-year average. The horizontal black line shows the average of the entire period. Chart from Rebekah Frankson and Kenneth E. Kunkel, State Climate Summaries 2022: Montana, National Centers for Environmental Information.
Precipitation:
Due to the Rocky Mountains, Montana has different expectations for precipitation between the mountains, which get a lot of snow in winter, and the eastern plains, which are very dry in comparison. On average, annual precipitation sees large swings from one year to the next in the state, but there is no overall trend since 1900.6 Likewise, drought shows no trend of becoming more frequent or intense in the state.7
State-Specific Issues:
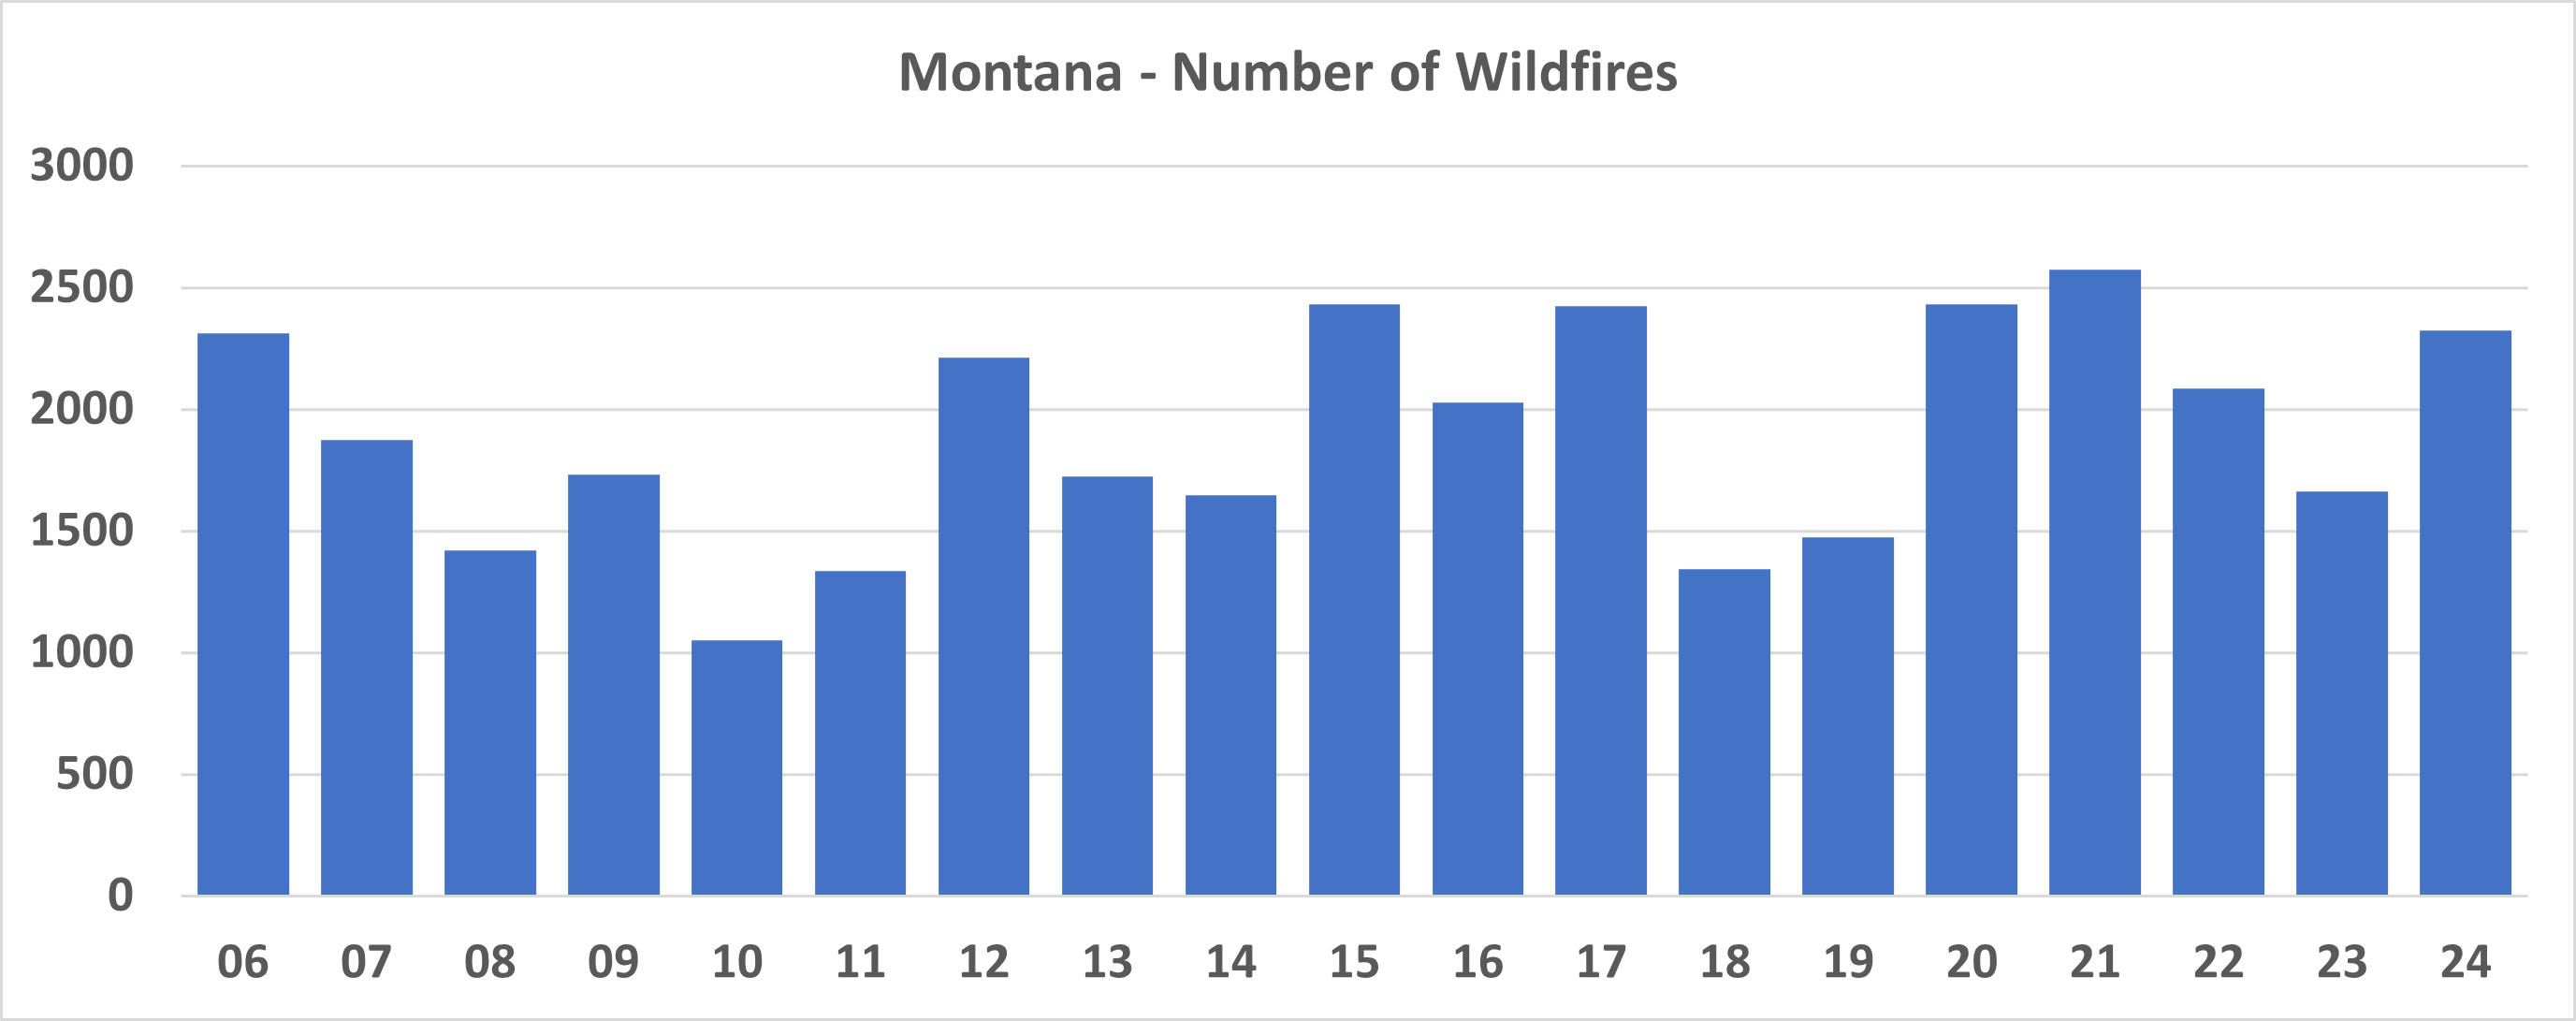
Montana is prone to wildfires, especially grass fires that burn large swaths of grassland and can be dangerous to homes, other structures, and even cattle. There is no statistically significant trend in the number of wildfires or acres burned in Montana since records began in 2006.8
Figure 3: Acres burned by wildfires in Montana since 2006, data from National Interagency Fire Center.
Figure 4: Number of wildfires in Montana since 2006, data from National Interagency Fire Center.
Montana is also prone to severe winter conditions like blizzards, especially in the western part of the state. The current record for snowfall in a single day occurred in 2006, with 51.8 inches of snow in Lewis and Clark County.9
Agriculture:
The Montana Department of Agriculture reports that cattle and wheat are the state’s biggest commodities, along with sugar beets, hay, and barley.10
Since 1988, cattle production (pounds) has remained relatively stable, rising 6 percent by 2023.11
From 1900 to 2024, wheat production (bushels) increased by an amazing 7,905 percent.12 Sugar beet production (tons) increased 130 percent between 1928 and 2024.13 Hay production (tons) increased 185 percent between 1909 and 2024,14 and barley production (bushels) increased by 5,740 percent from 1900 to 2024.15
Conclusion
All the above data considered, there is no evidence Montana is suffering due to the modest warming over the past hundred-plus years. While warming has occurred, heat extremes have not worsened, deadly cold extremes have declined, precipitation conditions remain about the same, and crop production increased markedly.
References:
“United States Koppen-Geiger Climate Classification Map.” plantmaps.com, January 20, 2024. https://www.plantmaps.com/koppen-climate-classification-map-united-states.php#google_vignette.
Rebekah Frankson and Kenneth E. Kunkel, State Climate Summaries 2022: Montana, National Centers for Environmental Information. Accessed April 16, 2025 https://statesummaries.ncics.org/chapter/mt/
Ibid.
Spencer, Roy W., John R. Christy, and William D. Braswell. “Urban Heat Island Effects in U.S. Summer Surface Temperature Data, 1895–2023”, Journal of Applied Meteorology and Climatology (published online ahead of print 2025), doi: https://doi.org/10.1175/JAMC-D-23-0199.1
See the most extreme temperatures in Montana history. Stacker. (2022, April 11). https://stacker.com/stories/montana/see-most-extreme-temperatures-montana-history
Rebekah Frankson and Kenneth E. Kunkel, State Climate Summaries 2022: Montana, National Centers for Environmental Information. Accessed April 16, 2025 https://statesummaries.ncics.org/chapter/mt/
National Interagency Coordination Center, NICC Annual Reports, accessed April 2025, https://www.nifc.gov/nicc/predictive-services/intelligence
“Snowfall Extremes.” National Centers for Environmental Information (NCEI), April 2025. https://www.ncei.noaa.gov/access/monitoring/snowfall-extremes/MT/1..
We use cookies to ensure that we give you the best experience on our website. If you continue to use this site we will assume that you are happy with it.