The number of “very hot” days has significantly declined in Wisconsin over the past century.
Average winter temperatures have increased modestly, mostly driven by winter low temperatures being moderately less frigid.
Average precipitation has increased over time, dispelling drought concerns.
Wisconsin’s major agricultural products, including dairy, corn, soybeans, and cranberries, have all increased production in recent decades as temperatures modestly warm.
Short Summary:
Temperature Trends:
Wisconsin is generally classified as temperate or warm continental, meaning humid and hot summers, and cold snowy winters.1 The regional weather is influenced by the Great Lakes.
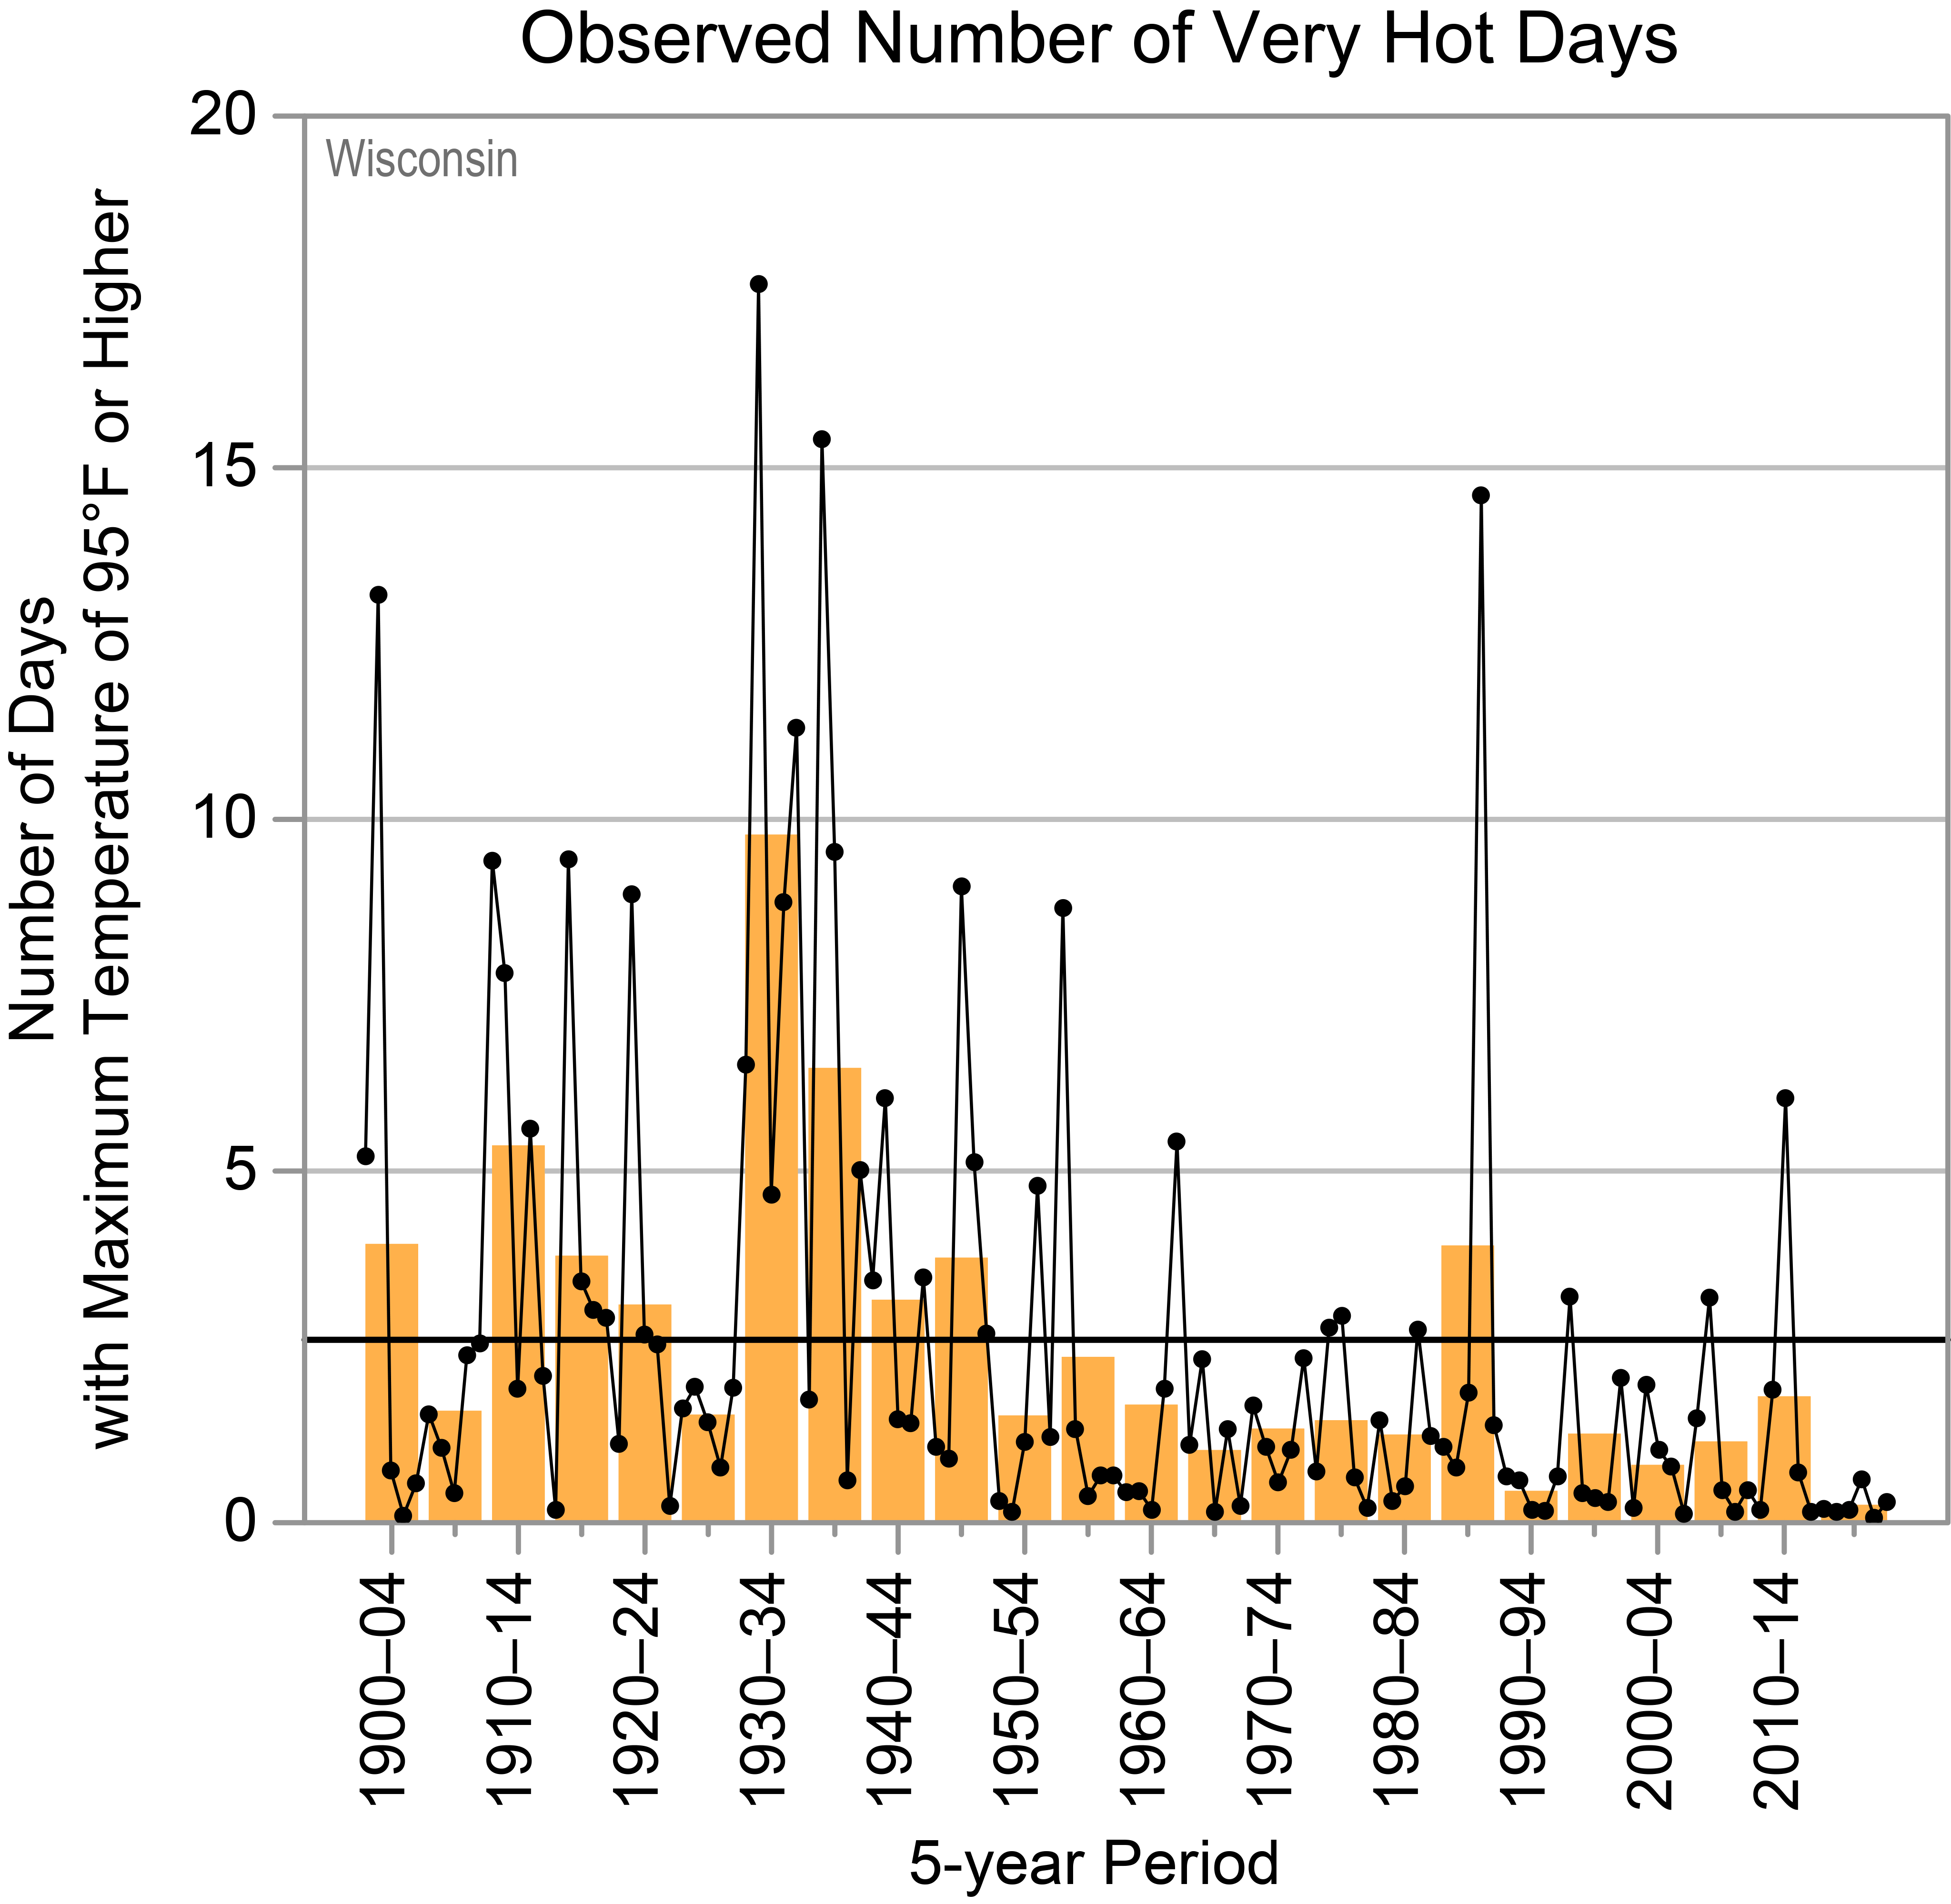
Wisconsin surface temperature stations show an increase of 2°F since the beginning of the twentieth century, though the number of “very hot” (maximum temperatures of 95°F or higher) days has declined significantly since the first half of the twentieth century.2 Even this modest warming is likely overstated, as explained below.
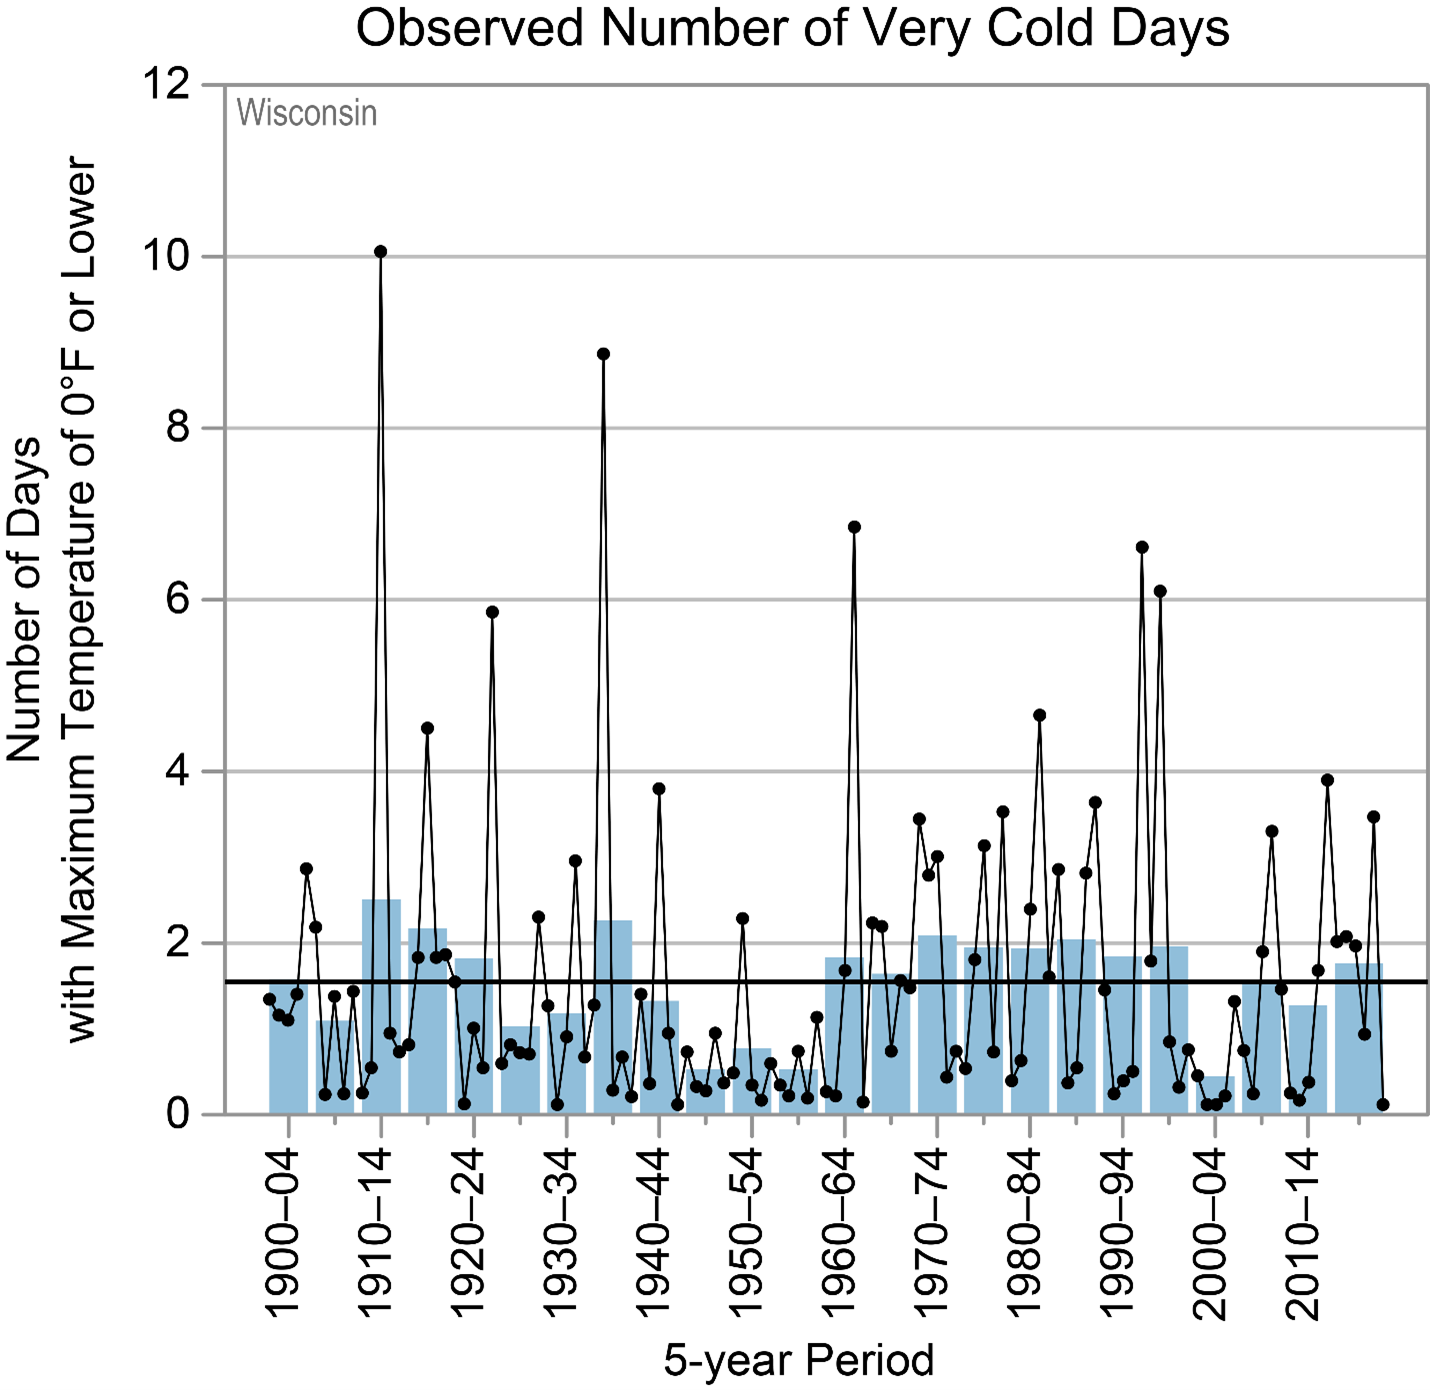
The frequency of warm nights in Wisconsin has not increased, either. Summer temperatures have not fluctuated much. By contrast, winter temperatures have increased modestly over the past century, and the number of “very cold” days has declined in recent years.3 Because extremely cold temperatures kill far more people than extremely hot temperatures, this moderating of winter temperatures is generally good for public health.4 Shorter winters and longer springs have also improved growing conditions.
Recent research indicates that a significant percentage of warming at surface stations in the United States can be attributed to urbanization, the urban heat island effect (UHI) rather than atmospheric warming driven by carbon dioxide emissions. Wisconsin has experienced substantial population growth over the past century, particularly in major metropolitan areas.5 Recent research strongly suggests that much of the reported 2°F warming in Wisconsin since 1900 is likely an artifact of growing population density driving the UHI.6
Figure 1: Annual number of “days with a maximum temperature of 95°F or higher. Orange bars are showing averages over 5 year periods, with the last bar a 6 year average. Dots are yearly values, and the horizontal line shows the long term average. Chart from Frankson, R., K.E. Kunkel, S.M. Champion, and L. Sun, 2022: Wisconsin State Climate Summary 2022.Figure 2: Observed annual number of very cold days (maximum temperature of 0°F or lower) for Wisconsin from 1900 to 2020. Dots show annual values. Bars show averages over 5-year periods (last bar is a 6-year average). The horizontal black line shows the long-term (entire period) average of 1.6 days. The number of very cold days has varied widely across the historical record. Wisconsin experienced the fewest number of very cold days during the 2000–2004 period, indicative of overall winter warming in the region. Sources: CISESS and NOAA NCEI. Data: GHCN-Daily from 25 long-term stations.
Precipitation:
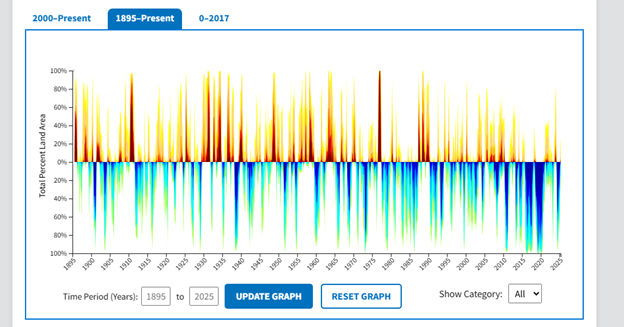
Precipitation has generally increased in Wisconsin over the past century.7 The modest average increase in summer and winter precipitation has likely contributed to the decline in the incidences and severity of droughts in Wisconsin over the past few decades.8 More winter snow and summer rain result in improved soil moisture conditions.
Figure 3: National Integrated Drought Information System: The Standardized Precipitation Index (SPI) is a monthly depiction of drought based on precipitation (with data going back to 1895).
State-Specific Issues:
The Great Lakes:
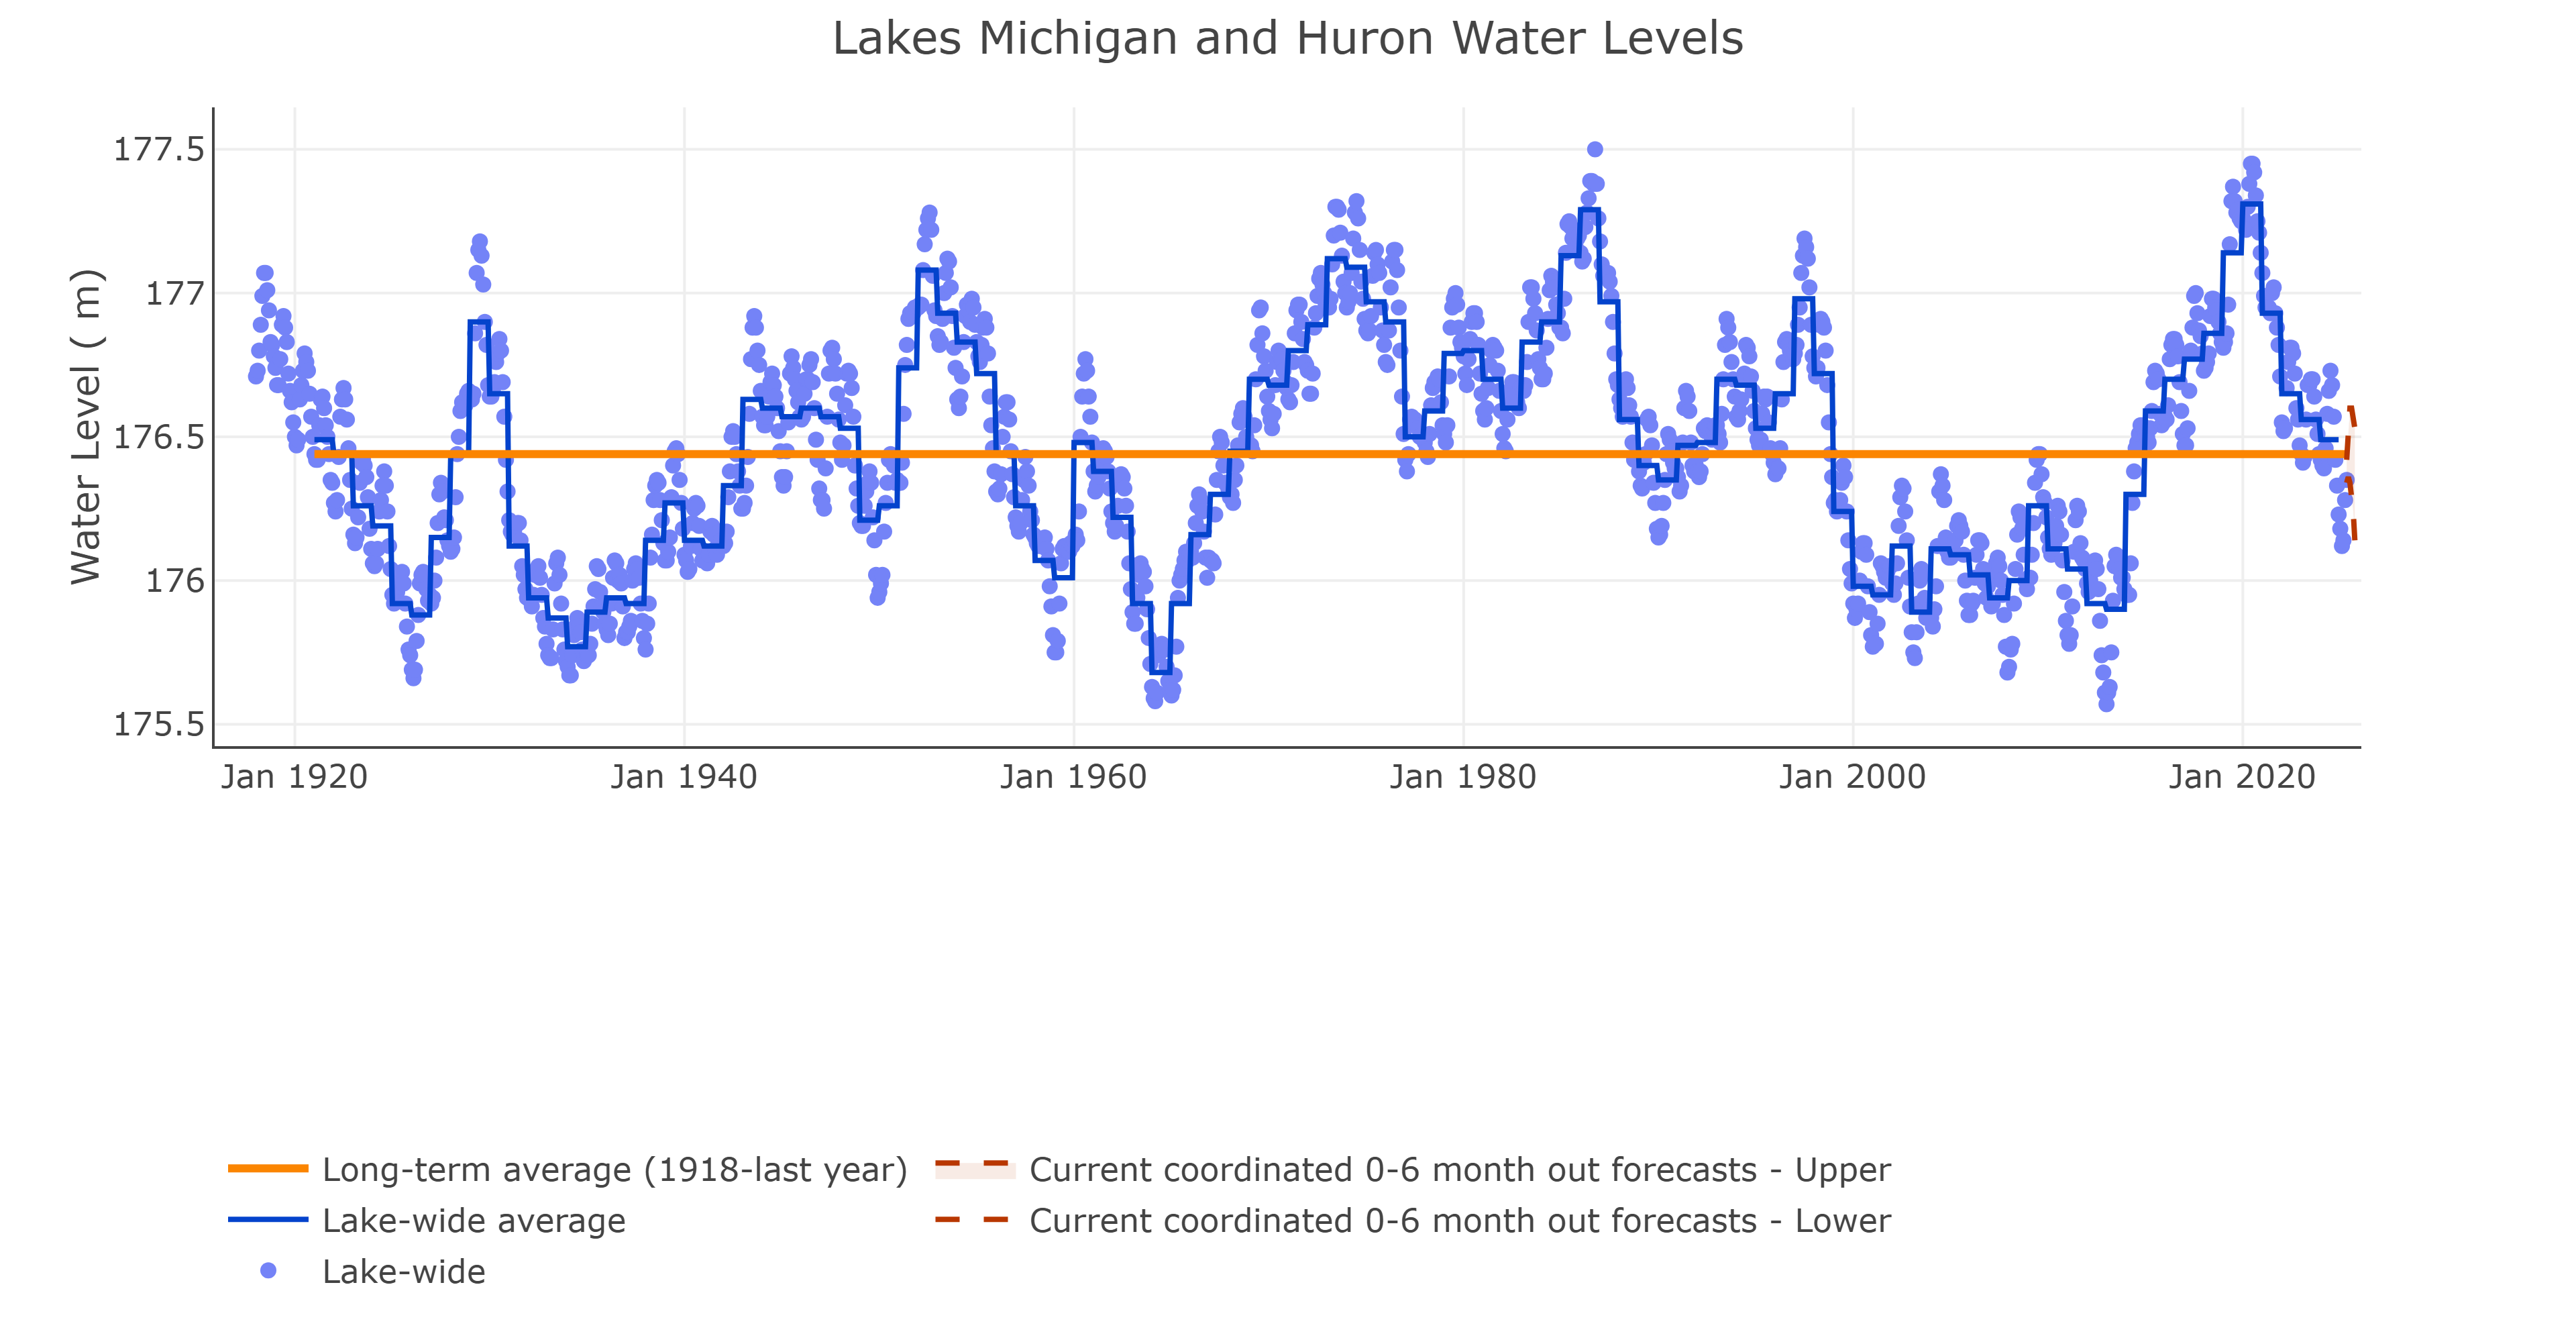
Wisconsin is bordered on its eastern edge by Lake Michigan, and in the northwest by Lake Superior. The Great Lakes provide a vital water source for Wisconsin, so water levels are important to track. Water levels for Lake Michigan-Huron fluctuate widely and naturally over time. The most recent record high occurred in 2020.9 Lake Superior’s water level has remained far more stable over time. Neither show any indication of a particular long-term trend for water level.
Figure 4: Lakes Michigan-Huron water levels since 1918. Chart from NOAA Great Lakes Environmental Research Laboratory “Great Lakes Water Level Dashboard.” Accessed May 16, 2025.
Severe Storms:
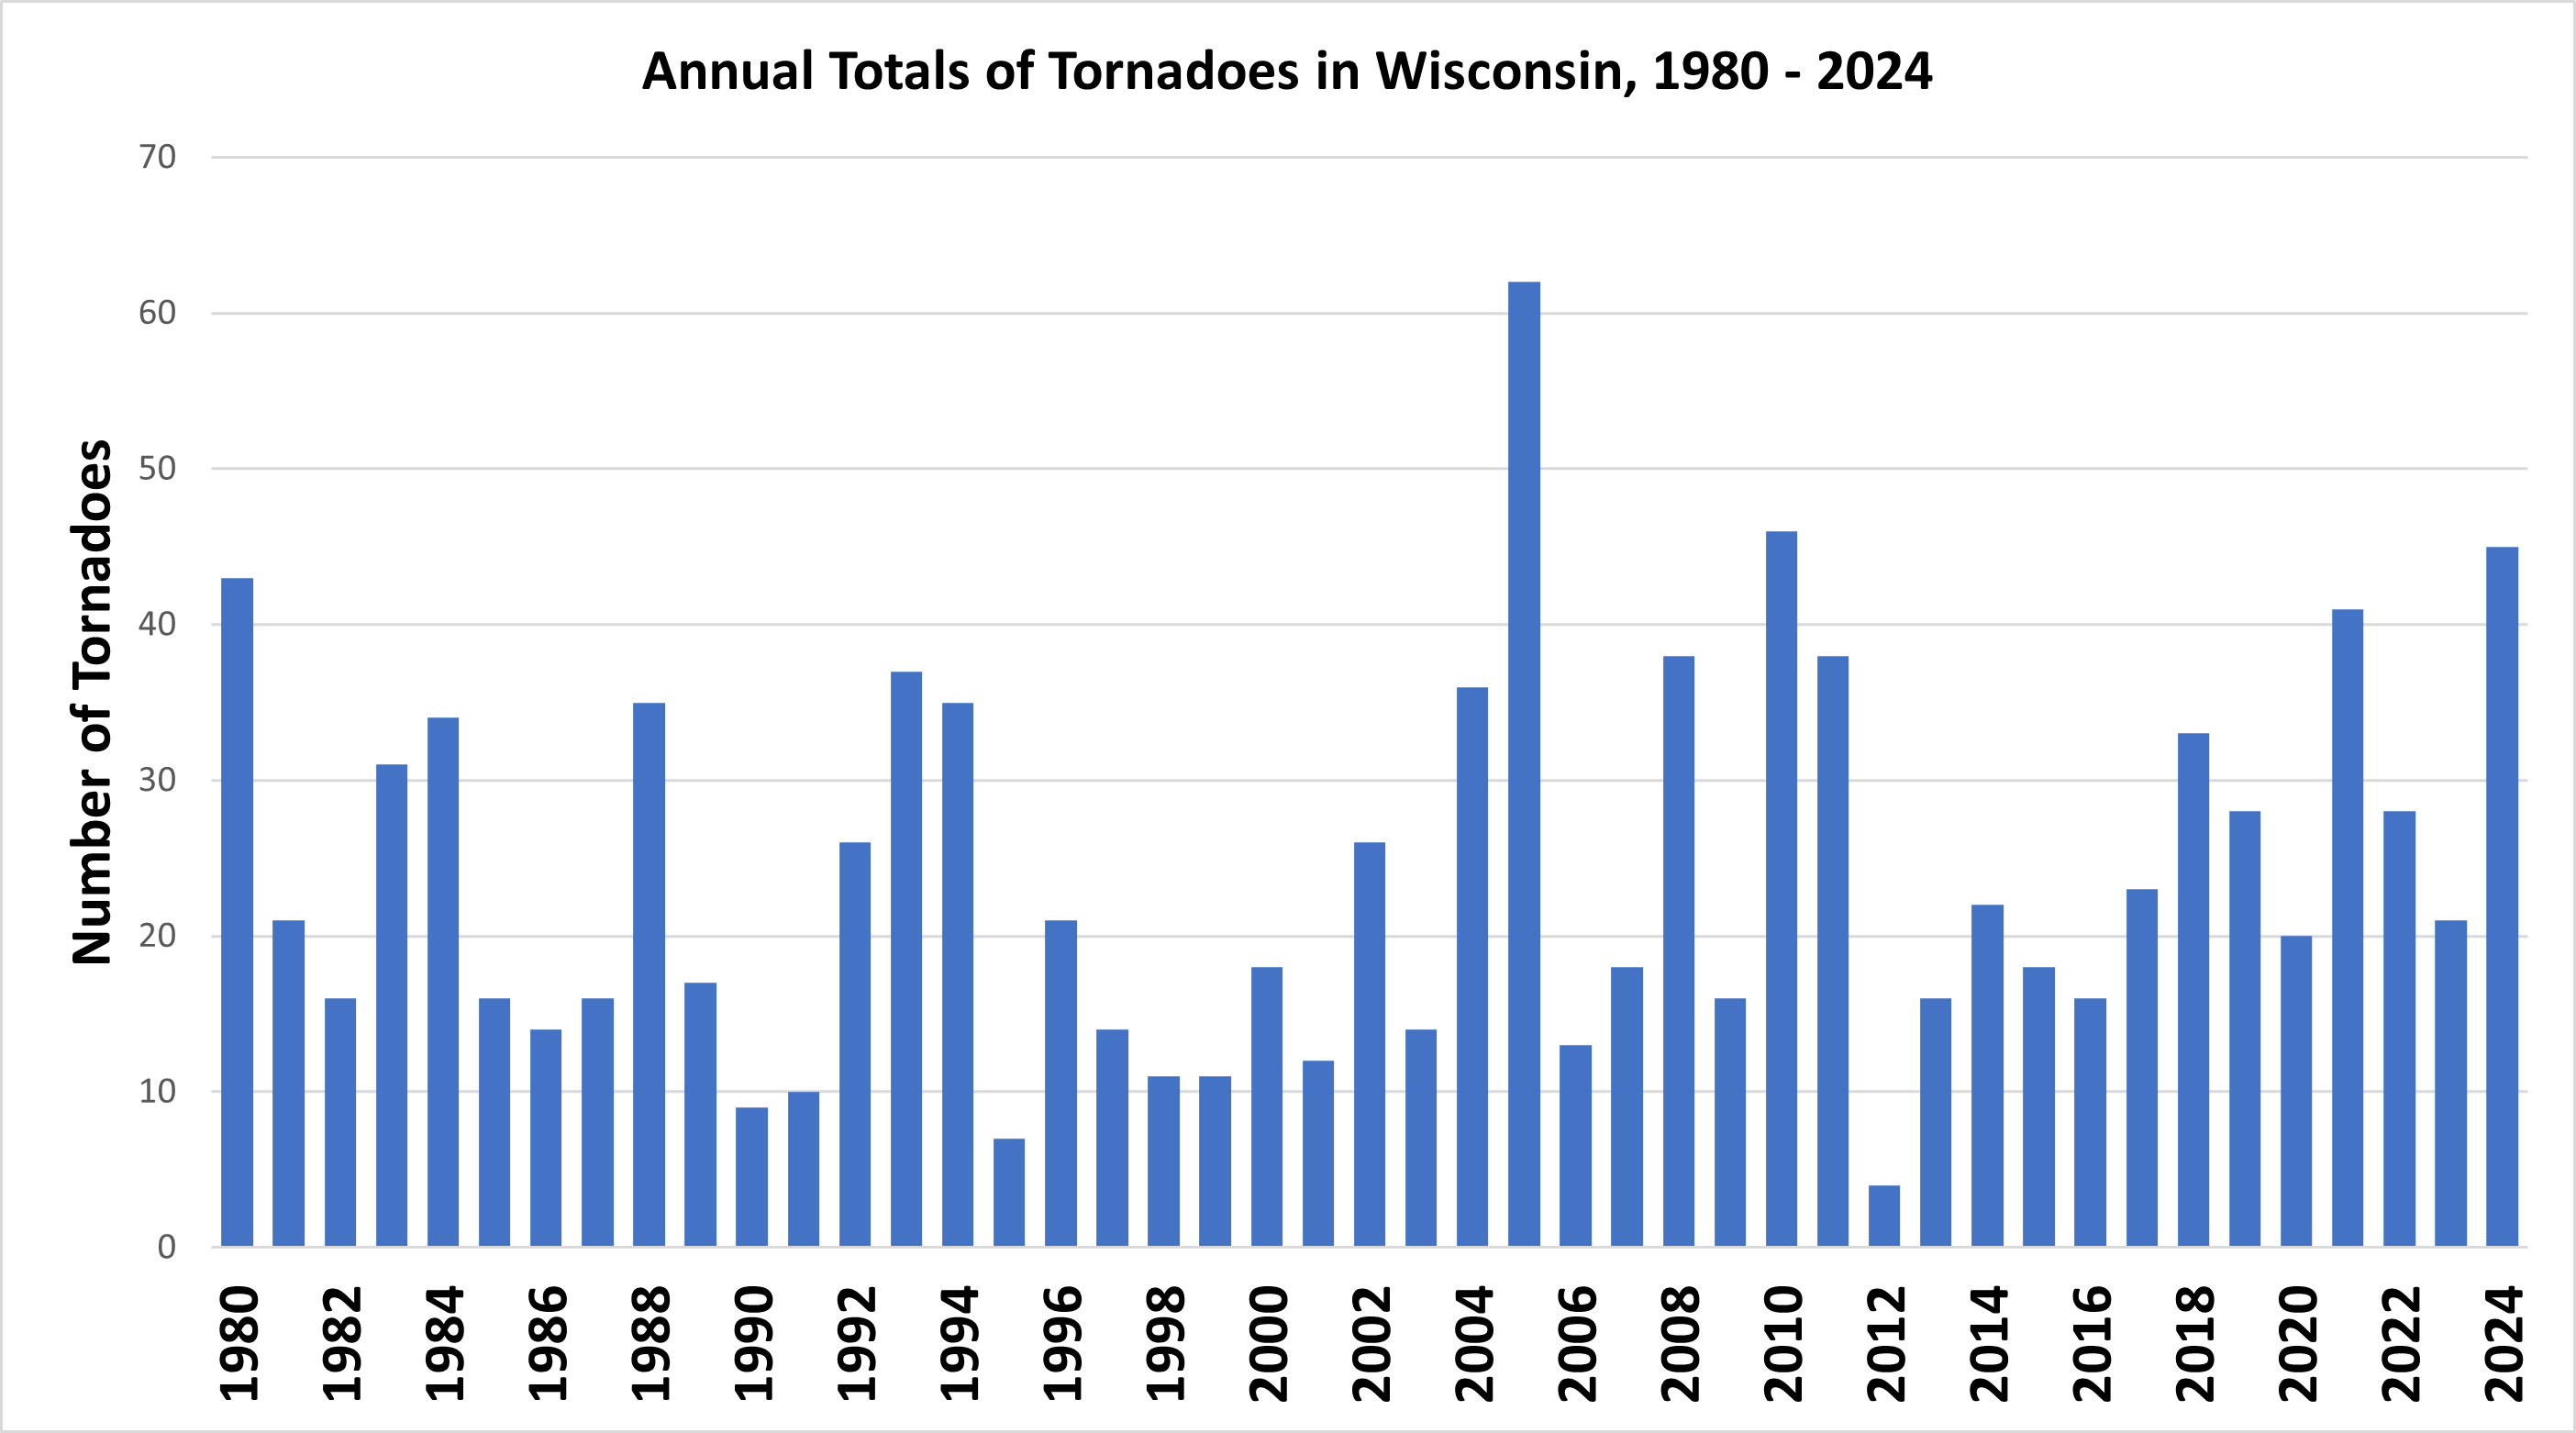
Severe thunderstorms across the Midwest often fuel tornadoes that impact Wisconsin. Data from the National Weather Service indicates that Wisconsin has not seen an increase in the number of tornadoes.10,11
Figure 5: Number of tornadoes per year in Wisconsin between 1980-2024. Data from National Weather Service.
Agriculture:
Wisconsin is an agriculturally rich state. Wisconsin is the top-producing dairy farming state in the country. Wisconsin also produces significant amounts of corn and soybeans and is the nation’s top cranberry-producing state. None of these agricultural products are suffering from climate change.
Notably, cheese production in Wisconsin has increased 87 percent since 1990, up to 3.5 billion pounds in 2024.12
According to USDA data, Wisconsin’s corn grain production, which includes corn for human and animal consumption, as well as ethanol production, has increased 45 percent since 1990,13 and soybean production rose an astounding 477 percent in that same period.14
The USDA state data for cranberries began in 2007. Since then, cranberry production in Wisconsin has increased by 43 percent. The top five highest production years were 2016, 2013, 2018, 2024, and 2017.15
Conclusion:
Harmful climate change is not evident in Wisconsin’s weather, climate, or agricultural data. Winter temperatures are not quite as cold, which benefits human health, not harms it.16 Neither flood nor tornado trends are worsening. Modest warming has boosted agricultural output, benefiting Wisconsin farmers and consumers.
“Historical Population Change Data (1910-2020).” Census.gov, August 6, 2022. https://www.census.gov/data/tables/time-series/dec/popchange-data-text.html.
Roy W. Spencer, John R. Christy, and William D. Braswell, “Urban Heat Island Effects in U.S. Summer Surface Temperature Data, 1895–2023,” Journal of Applied Meteorology and Climatology, published online ahead of print 2025, https://doi.org/10.1175/JAMC-D-23-0199.1.
Frankson, R., K.E. Kunkel, S.M. Champion, and L. Sun, 2022: Wisconsin State Climate Summary 2022.
National Integrated Drought Information System (NIDIS), Wisconsin State Drought Information, U.S. Drought Portal, accessed June 10, 2025, https://www.drought.gov/states/wisconsin.
“NOAA Great Lakes Environmental Research Laboratory (Glerl) Great Lakes Dashboard.” NOAA Great Lakes Environmental Research Laboratory. Accessed May 16, 2025. https://www.glerl.noaa.gov/data/wlevels/dashboard/.
“Wisconsin Tornado and Severe Weather Statistics.” National Weather Service, July 9, 2019. https://www.weather.gov/grb/WI_tornado_stats.
“Wisconsin Tornado Information.” National Weather Service, January 31, 2025. https://www.weather.gov/mkx/wisconsintornadoes.
The number of “very hot” days has significantly declined in Wisconsin over the past century.
Average winter temperatures have increased modestly, mostly driven by winter low temperatures being moderately less frigid.
Average precipitation has increased over time, dispelling drought concerns.
Wisconsin’s major agricultural products, including dairy, corn, soybeans, and cranberries, have all increased production in recent decades as temperatures modestly warm.
Short Summary:
Temperature Trends:
Wisconsin is generally classified as temperate or warm continental, meaning humid and hot summers, and cold snowy winters.1 The regional weather is influenced by the Great Lakes.
Wisconsin surface temperature stations show an increase of 2°F since the beginning of the twentieth century, though the number of “very hot” (maximum temperatures of 95°F or higher) days has declined significantly since the first half of the twentieth century.2 Even this modest warming is likely overstated, as explained below.
The frequency of warm nights in Wisconsin has not increased, either. Summer temperatures have not fluctuated much. By contrast, winter temperatures have increased modestly over the past century, and the number of “very cold” days has declined in recent years.3 Because extremely cold temperatures kill far more people than extremely hot temperatures, this moderating of winter temperatures is generally good for public health.4 Shorter winters and longer springs have also improved growing conditions.
Recent research indicates that a significant percentage of warming at surface stations in the United States can be attributed to urbanization, the urban heat island effect (UHI) rather than atmospheric warming driven by carbon dioxide emissions. Wisconsin has experienced substantial population growth over the past century, particularly in major metropolitan areas.5 Recent research strongly suggests that much of the reported 2°F warming in Wisconsin since 1900 is likely an artifact of growing population density driving the UHI.6
Figure 1: Annual number of “days with a maximum temperature of 95°F or higher. Orange bars are showing averages over 5 year periods, with the last bar a 6 year average. Dots are yearly values, and the horizontal line shows the long term average. Chart from Frankson, R., K.E. Kunkel, S.M. Champion, and L. Sun, 2022: Wisconsin State Climate Summary 2022.Figure 2: Observed annual number of very cold days (maximum temperature of 0°F or lower) for Wisconsin from 1900 to 2020. Dots show annual values. Bars show averages over 5-year periods (last bar is a 6-year average). The horizontal black line shows the long-term (entire period) average of 1.6 days. The number of very cold days has varied widely across the historical record. Wisconsin experienced the fewest number of very cold days during the 2000–2004 period, indicative of overall winter warming in the region. Sources: CISESS and NOAA NCEI. Data: GHCN-Daily from 25 long-term stations.
Precipitation:
Precipitation has generally increased in Wisconsin over the past century.7 The modest average increase in summer and winter precipitation has likely contributed to the decline in the incidences and severity of droughts in Wisconsin over the past few decades.8 More winter snow and summer rain result in improved soil moisture conditions.
Figure 3: National Integrated Drought Information System: The Standardized Precipitation Index (SPI) is a monthly depiction of drought based on precipitation (with data going back to 1895).
State-Specific Issues:
The Great Lakes:
Wisconsin is bordered on its eastern edge by Lake Michigan, and in the northwest by Lake Superior. The Great Lakes provide a vital water source for Wisconsin, so water levels are important to track. Water levels for Lake Michigan-Huron fluctuate widely and naturally over time. The most recent record high occurred in 2020.9 Lake Superior’s water level has remained far more stable over time. Neither show any indication of a particular long-term trend for water level.
Figure 4: Lakes Michigan-Huron water levels since 1918. Chart from NOAA Great Lakes Environmental Research Laboratory “Great Lakes Water Level Dashboard.” Accessed May 16, 2025.
Severe Storms:
Severe thunderstorms across the Midwest often fuel tornadoes that impact Wisconsin. Data from the National Weather Service indicates that Wisconsin has not seen an increase in the number of tornadoes.10,11
Figure 5: Number of tornadoes per year in Wisconsin between 1980-2024. Data from National Weather Service.
Agriculture:
Wisconsin is an agriculturally rich state. Wisconsin is the top-producing dairy farming state in the country. Wisconsin also produces significant amounts of corn and soybeans and is the nation’s top cranberry-producing state. None of these agricultural products are suffering from climate change.
Notably, cheese production in Wisconsin has increased 87 percent since 1990, up to 3.5 billion pounds in 2024.12
According to USDA data, Wisconsin’s corn grain production, which includes corn for human and animal consumption, as well as ethanol production, has increased 45 percent since 1990,13 and soybean production rose an astounding 477 percent in that same period.14
The USDA state data for cranberries began in 2007. Since then, cranberry production in Wisconsin has increased by 43 percent. The top five highest production years were 2016, 2013, 2018, 2024, and 2017.15
Conclusion:
Harmful climate change is not evident in Wisconsin’s weather, climate, or agricultural data. Winter temperatures are not quite as cold, which benefits human health, not harms it.16 Neither flood nor tornado trends are worsening. Modest warming has boosted agricultural output, benefiting Wisconsin farmers and consumers.
“Historical Population Change Data (1910-2020).” Census.gov, August 6, 2022. https://www.census.gov/data/tables/time-series/dec/popchange-data-text.html.
Roy W. Spencer, John R. Christy, and William D. Braswell, “Urban Heat Island Effects in U.S. Summer Surface Temperature Data, 1895–2023,” Journal of Applied Meteorology and Climatology, published online ahead of print 2025, https://doi.org/10.1175/JAMC-D-23-0199.1.
Frankson, R., K.E. Kunkel, S.M. Champion, and L. Sun, 2022: Wisconsin State Climate Summary 2022.
National Integrated Drought Information System (NIDIS), Wisconsin State Drought Information, U.S. Drought Portal, accessed June 10, 2025, https://www.drought.gov/states/wisconsin.
“NOAA Great Lakes Environmental Research Laboratory (Glerl) Great Lakes Dashboard.” NOAA Great Lakes Environmental Research Laboratory. Accessed May 16, 2025. https://www.glerl.noaa.gov/data/wlevels/dashboard/.
“Wisconsin Tornado and Severe Weather Statistics.” National Weather Service, July 9, 2019. https://www.weather.gov/grb/WI_tornado_stats.
“Wisconsin Tornado Information.” National Weather Service, January 31, 2025. https://www.weather.gov/mkx/wisconsintornadoes.
We use cookies to ensure that we give you the best experience on our website. If you continue to use this site we will assume that you are happy with it.