Rhode Island has modestly warmed, but a decline in the number of very cold days has led to a lower environment-related death rate.
Precipitation has improved since the 1960s, which is a boon to agriculture.
Drought shows no sign of worsening.
Important industries like agriculture are aquaculture are thriving.
Short Summary:
Temperature Trends:
As a coastal state, Rhode Island has a continental climate, including distinct seasons with hot, humid summers, and cold, wet winters.1
Overall, the National Oceanic and Atmospheric Administration (NOAA) asserts average temperatures in Rhode Island have increased by around 4°F since 1900.2 A large part of the reason for this increase is the significant decline in the number of dangerous “very cold” (minimum temperatures of 0°F or lower) nights since the 1980s.3 This benefits the people of Rhode Island because cold temperatures kill far more people than extreme heat.4
Rhode Island is an outlier from the rest of the contiguous United States when it comes to daily maximum temperature trends, which have increased. This is likely due to the fact that it is the smallest state by land area and is largely developed with relatively little rural space in comparison to other states. As a result, the Urban Heat Island effect, which typically raises average nighttime lows and daytime highs, has also likely contributed to the state’s measured localized average temperature increase.
Precipitation:
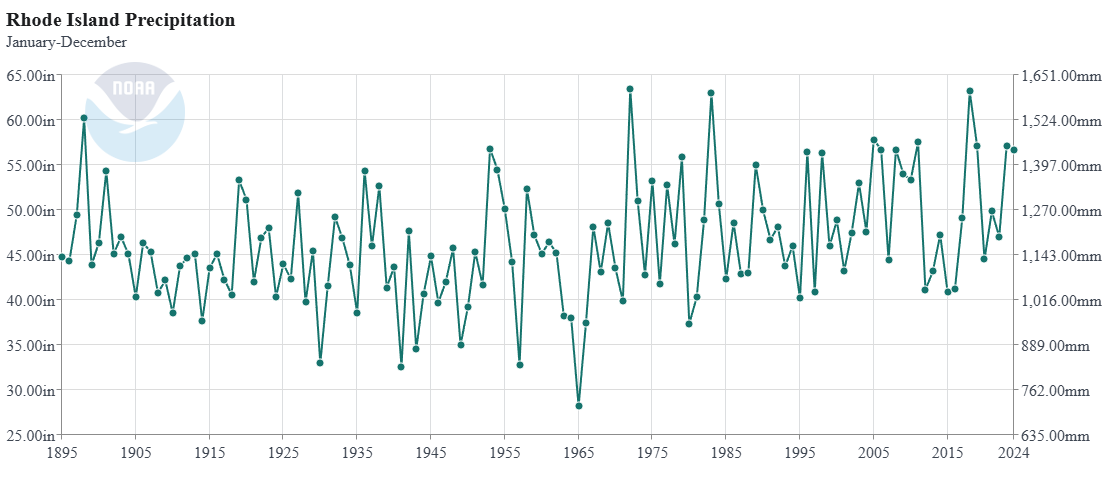
Overall precipitation has been higher during the past 50 years compared to previous decades, which reduces drought frequency.5
Figure 1: Precipitation trend from 1895 to 2024, figure from NOAA National Centers for Environmental information.
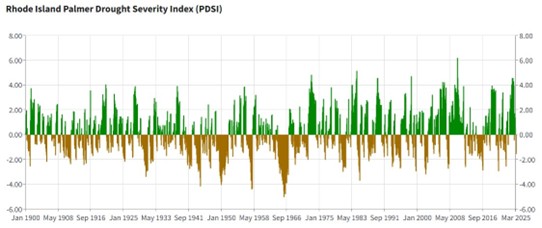
Drought data for Rhode Island show that drought is not increasing in severity or frequency. The worst drought conditions occurred during the 1950s and 1960s, and this matches the precipitation data trend fairly well.6
Figure 2: Time Series of Palmer Drought Severity Index (PDSI), green represents wet conditions, brown drought. Figure from NOAA National Centers for Environmental information.
State-Specific Issues:
Sea Level Rise
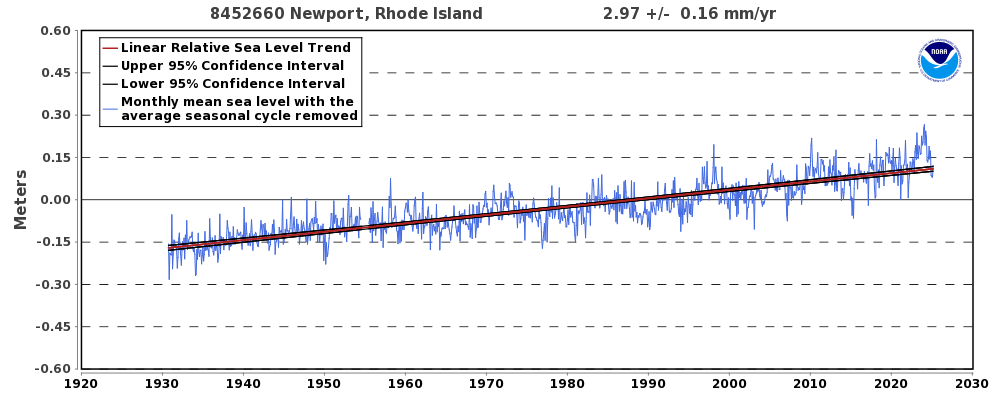
Sea level rise is often cited as a climate issue for Rhode Island, but data indicate the current rate and amount of rise is minor. Current rates of relative sea level change for Rhode Island sea level stations show about 2.97 mm per year in Newport, and 2.56 mm per year in Providence.7 Averaging those rates gives about a 207 mm rise by 2100 – about 8 inches. This is approximately the same rate of rise that occurred throughout the twentieth century, meaning there has been no measurable increase in the rate of rise for more than 100 years.
Figure 3: Figure from NOAA Tides & Currents, “Mean Sea Level Trend: Newport, Rhode Island – Station ID 8452660,” National Oceanic and Atmospheric Administration
Agriculture:
Most of Rhode Island’s agriculture comes in the form of the greenhouse industry, which produces a variety of products from food crops to floriculture and is largely shielded from most impacts of the climate and weather.8
Poultry is Rhode Island’s number two commodity, especially chicken eggs, which are also largely produced indoors, and turkeys. Turkey inventory data show that the number of turkeys kept in Rhode Island have increased 705 percent since census recordkeeping begins in 1997.9
Honey is another popular product, and it too has seen increasing production, up 601 percent since 1997.10
Being a coastal state, aquaculture is a significant part of Rhode Island’s economy, and oyster farms and other aquaculture are beginning to boom again as historic restrictions were lifted, and issues of local water pollution addressed.11 Despite barriers, aquaculture sales from Rhode Island (including shellfish and fish) increased from less than $1 million in 2005 to more than $8 million in 2023.12
In short, there is no evidence that climate change is having a negative impact on Rhode Island agriculture.
Conclusion:
Despite being an outlier in daytime warming trends, data does not indicate that climate change is harming Rhode Island with worsening weather or damage to important agricultural output.
References:
“United States Koppen-Geiger Climate Classification Map.” plantmaps.com, January 20, 2024. https://www.plantmaps.com/koppen-climate-classification-map-united-states.php#google_vignette.
Jennifer Runkle, Kenneth E. Kunkel, David R. Easterling, Benjamin C. Stewart, Sarah M. Champion, Laura E. Stevens, Richard Frankson, William Sweet, and Jessica Spaccio, Rhode Island State Climate Summary 2022, NOAA Technical Report NESDIS 150-RI (Silver Spring, MD: NOAA/NESDIS, 2022), https://statesummaries.ncics.org/chapter/ri/.
Runkle et al., Rhode Island State Climate Summary 2022, https://statesummaries.ncics.org/chapter/ri/.
Anthony Watts and James Taylor, ed. H. Sterling Burnett, Climate at a Glance: Temperature-Related Deaths, Heartland Institute, accessed June 10, 2025, https://climateataglance.com/climate-at-a-glance-temperature-related-deaths/
National Centers for Environmental Information, “Climate at a Glance: Rhode Island Precipitation, December 1895–2025,” NOAA National Centers for Environmental Information, accessed June 11, 2025, https://www.ncei.noaa.gov/access/monitoring/climate-at-a-glance/statewide/time-series/37/pcp/12/12/1895-2025.
National Centers for Environmental information, “Climate at a Glance: Rhode Island Palmer Drought Severity Index, 1900-2025,” NOAA National Centers for Environmental Information, accessed April 29, 2025, https://www.ncei.noaa.gov/access/monitoring/climate-at-a-glance/statewide/time-series.
NOAA Tides & Currents, “Sea Level Trends – Rhode Island,” National Oceanic and Atmospheric Administration, accessed June 11, 2025, https://tidesandcurrents.noaa.gov/sltrends/sltrends_states.html?gid=1241.
Farm Flavor, “Top Rhode Island Agriculture Facts from the 2024 Census of Agriculture,” Farm Flavor, accessed June 11, 2025, https://farmflavor.com/rhode-island/rhode-island-crops-livestock/top-rhode-island-agriculture-facts-from-the-2024-census-of-agriculture/.
S. Department of Agriculture, National Agricultural Statistics Service, Quick Stats Database: Turkeys, Inventory Total, Rhode Island, 1997-2022, accessed June 11, 2025, https://quickstats.nass.usda.gov/results/ACDC6CA2-64CE-3107-8E05-B33AC5DC6085.
S. Department of Agriculture, National Agricultural Statistics Service, Quick Stats Database: Honey, Production, Rhode Island, 1997-2022, accessed June 11, 2025, https://quickstats.nass.usda.gov/results/03EA724E-1037-357D-B9B4-E8E3130662FC.
Rob Smith, “Future of R.I. Shellfish Farming Bright,” ecoRI News, accessed June 11, 2025, https://ecori.org/future-of-r-i-shellfish-farming-bright/.
S. Department of Agriculture, National Agricultural Statistics Service, Quick Stats Database: Aquaculture Totals, Sales, Rhode Island, 1997-2022, accessed June 11, 2025, https://quickstats.nass.usda.gov/results/5BBC7939-0E47-3C70-89B5-2FD4EC3A689B.
Rhode Island has modestly warmed, but a decline in the number of very cold days has led to a lower environment-related death rate.
Precipitation has improved since the 1960s, which is a boon to agriculture.
Drought shows no sign of worsening.
Important industries like agriculture are aquaculture are thriving.
Short Summary:
Temperature Trends:
As a coastal state, Rhode Island has a continental climate, including distinct seasons with hot, humid summers, and cold, wet winters.1
Overall, the National Oceanic and Atmospheric Administration (NOAA) asserts average temperatures in Rhode Island have increased by around 4°F since 1900.2 A large part of the reason for this increase is the significant decline in the number of dangerous “very cold” (minimum temperatures of 0°F or lower) nights since the 1980s.3 This benefits the people of Rhode Island because cold temperatures kill far more people than extreme heat.4
Rhode Island is an outlier from the rest of the contiguous United States when it comes to daily maximum temperature trends, which have increased. This is likely due to the fact that it is the smallest state by land area and is largely developed with relatively little rural space in comparison to other states. As a result, the Urban Heat Island effect, which typically raises average nighttime lows and daytime highs, has also likely contributed to the state’s measured localized average temperature increase.
Precipitation:
Overall precipitation has been higher during the past 50 years compared to previous decades, which reduces drought frequency.5
Figure 1: Precipitation trend from 1895 to 2024, figure from NOAA National Centers for Environmental information.
Drought data for Rhode Island show that drought is not increasing in severity or frequency. The worst drought conditions occurred during the 1950s and 1960s, and this matches the precipitation data trend fairly well.6
Figure 2: Time Series of Palmer Drought Severity Index (PDSI), green represents wet conditions, brown drought. Figure from NOAA National Centers for Environmental information.
State-Specific Issues:
Sea Level Rise
Sea level rise is often cited as a climate issue for Rhode Island, but data indicate the current rate and amount of rise is minor. Current rates of relative sea level change for Rhode Island sea level stations show about 2.97 mm per year in Newport, and 2.56 mm per year in Providence.7 Averaging those rates gives about a 207 mm rise by 2100 – about 8 inches. This is approximately the same rate of rise that occurred throughout the twentieth century, meaning there has been no measurable increase in the rate of rise for more than 100 years.
Figure 3: Figure from NOAA Tides & Currents, “Mean Sea Level Trend: Newport, Rhode Island – Station ID 8452660,” National Oceanic and Atmospheric Administration
Agriculture:
Most of Rhode Island’s agriculture comes in the form of the greenhouse industry, which produces a variety of products from food crops to floriculture and is largely shielded from most impacts of the climate and weather.8
Poultry is Rhode Island’s number two commodity, especially chicken eggs, which are also largely produced indoors, and turkeys. Turkey inventory data show that the number of turkeys kept in Rhode Island have increased 705 percent since census recordkeeping begins in 1997.9
Honey is another popular product, and it too has seen increasing production, up 601 percent since 1997.10
Being a coastal state, aquaculture is a significant part of Rhode Island’s economy, and oyster farms and other aquaculture are beginning to boom again as historic restrictions were lifted, and issues of local water pollution addressed.11 Despite barriers, aquaculture sales from Rhode Island (including shellfish and fish) increased from less than $1 million in 2005 to more than $8 million in 2023.12
In short, there is no evidence that climate change is having a negative impact on Rhode Island agriculture.
Conclusion:
Despite being an outlier in daytime warming trends, data does not indicate that climate change is harming Rhode Island with worsening weather or damage to important agricultural output.
References:
“United States Koppen-Geiger Climate Classification Map.” plantmaps.com, January 20, 2024. https://www.plantmaps.com/koppen-climate-classification-map-united-states.php#google_vignette.
Jennifer Runkle, Kenneth E. Kunkel, David R. Easterling, Benjamin C. Stewart, Sarah M. Champion, Laura E. Stevens, Richard Frankson, William Sweet, and Jessica Spaccio, Rhode Island State Climate Summary 2022, NOAA Technical Report NESDIS 150-RI (Silver Spring, MD: NOAA/NESDIS, 2022), https://statesummaries.ncics.org/chapter/ri/.
Runkle et al., Rhode Island State Climate Summary 2022, https://statesummaries.ncics.org/chapter/ri/.
Anthony Watts and James Taylor, ed. H. Sterling Burnett, Climate at a Glance: Temperature-Related Deaths, Heartland Institute, accessed June 10, 2025, https://climateataglance.com/climate-at-a-glance-temperature-related-deaths/
National Centers for Environmental Information, “Climate at a Glance: Rhode Island Precipitation, December 1895–2025,” NOAA National Centers for Environmental Information, accessed June 11, 2025, https://www.ncei.noaa.gov/access/monitoring/climate-at-a-glance/statewide/time-series/37/pcp/12/12/1895-2025.
National Centers for Environmental information, “Climate at a Glance: Rhode Island Palmer Drought Severity Index, 1900-2025,” NOAA National Centers for Environmental Information, accessed April 29, 2025, https://www.ncei.noaa.gov/access/monitoring/climate-at-a-glance/statewide/time-series.
NOAA Tides & Currents, “Sea Level Trends – Rhode Island,” National Oceanic and Atmospheric Administration, accessed June 11, 2025, https://tidesandcurrents.noaa.gov/sltrends/sltrends_states.html?gid=1241.
Farm Flavor, “Top Rhode Island Agriculture Facts from the 2024 Census of Agriculture,” Farm Flavor, accessed June 11, 2025, https://farmflavor.com/rhode-island/rhode-island-crops-livestock/top-rhode-island-agriculture-facts-from-the-2024-census-of-agriculture/.
S. Department of Agriculture, National Agricultural Statistics Service, Quick Stats Database: Turkeys, Inventory Total, Rhode Island, 1997-2022, accessed June 11, 2025, https://quickstats.nass.usda.gov/results/ACDC6CA2-64CE-3107-8E05-B33AC5DC6085.
S. Department of Agriculture, National Agricultural Statistics Service, Quick Stats Database: Honey, Production, Rhode Island, 1997-2022, accessed June 11, 2025, https://quickstats.nass.usda.gov/results/03EA724E-1037-357D-B9B4-E8E3130662FC.
Rob Smith, “Future of R.I. Shellfish Farming Bright,” ecoRI News, accessed June 11, 2025, https://ecori.org/future-of-r-i-shellfish-farming-bright/.
S. Department of Agriculture, National Agricultural Statistics Service, Quick Stats Database: Aquaculture Totals, Sales, Rhode Island, 1997-2022, accessed June 11, 2025, https://quickstats.nass.usda.gov/results/5BBC7939-0E47-3C70-89B5-2FD4EC3A689B.
We use cookies to ensure that we give you the best experience on our website. If you continue to use this site we will assume that you are happy with it.