Florida has seen no increase in the number of days with extreme heat.
The modest warming of the past century is driven entirely by higher lows at night, and declines in freezing nights, which is driven more by urbanization’s impact on temperature rather than climate change.
Florida has experienced no change in its precipitation trend.
Florida has experienced no change in hurricane landfall or intensity trends.
Short Summary:
Temperature Trends:
Florida is a humid, tropical state. The majority of the state is classified as “humid subtropical,” meaning it rarely drops below 0° F in winter, and is hot and humid in summer.1 The southernmost tip of the state gets enough rain that it can be classified as tropical rainforest, and the whole state receives quite a bit of precipitation in the summer months—famously in the afternoons or evenings—during the “rainy season” due to the state’s position surrounded by the Gulf and Atlantic Ocean.
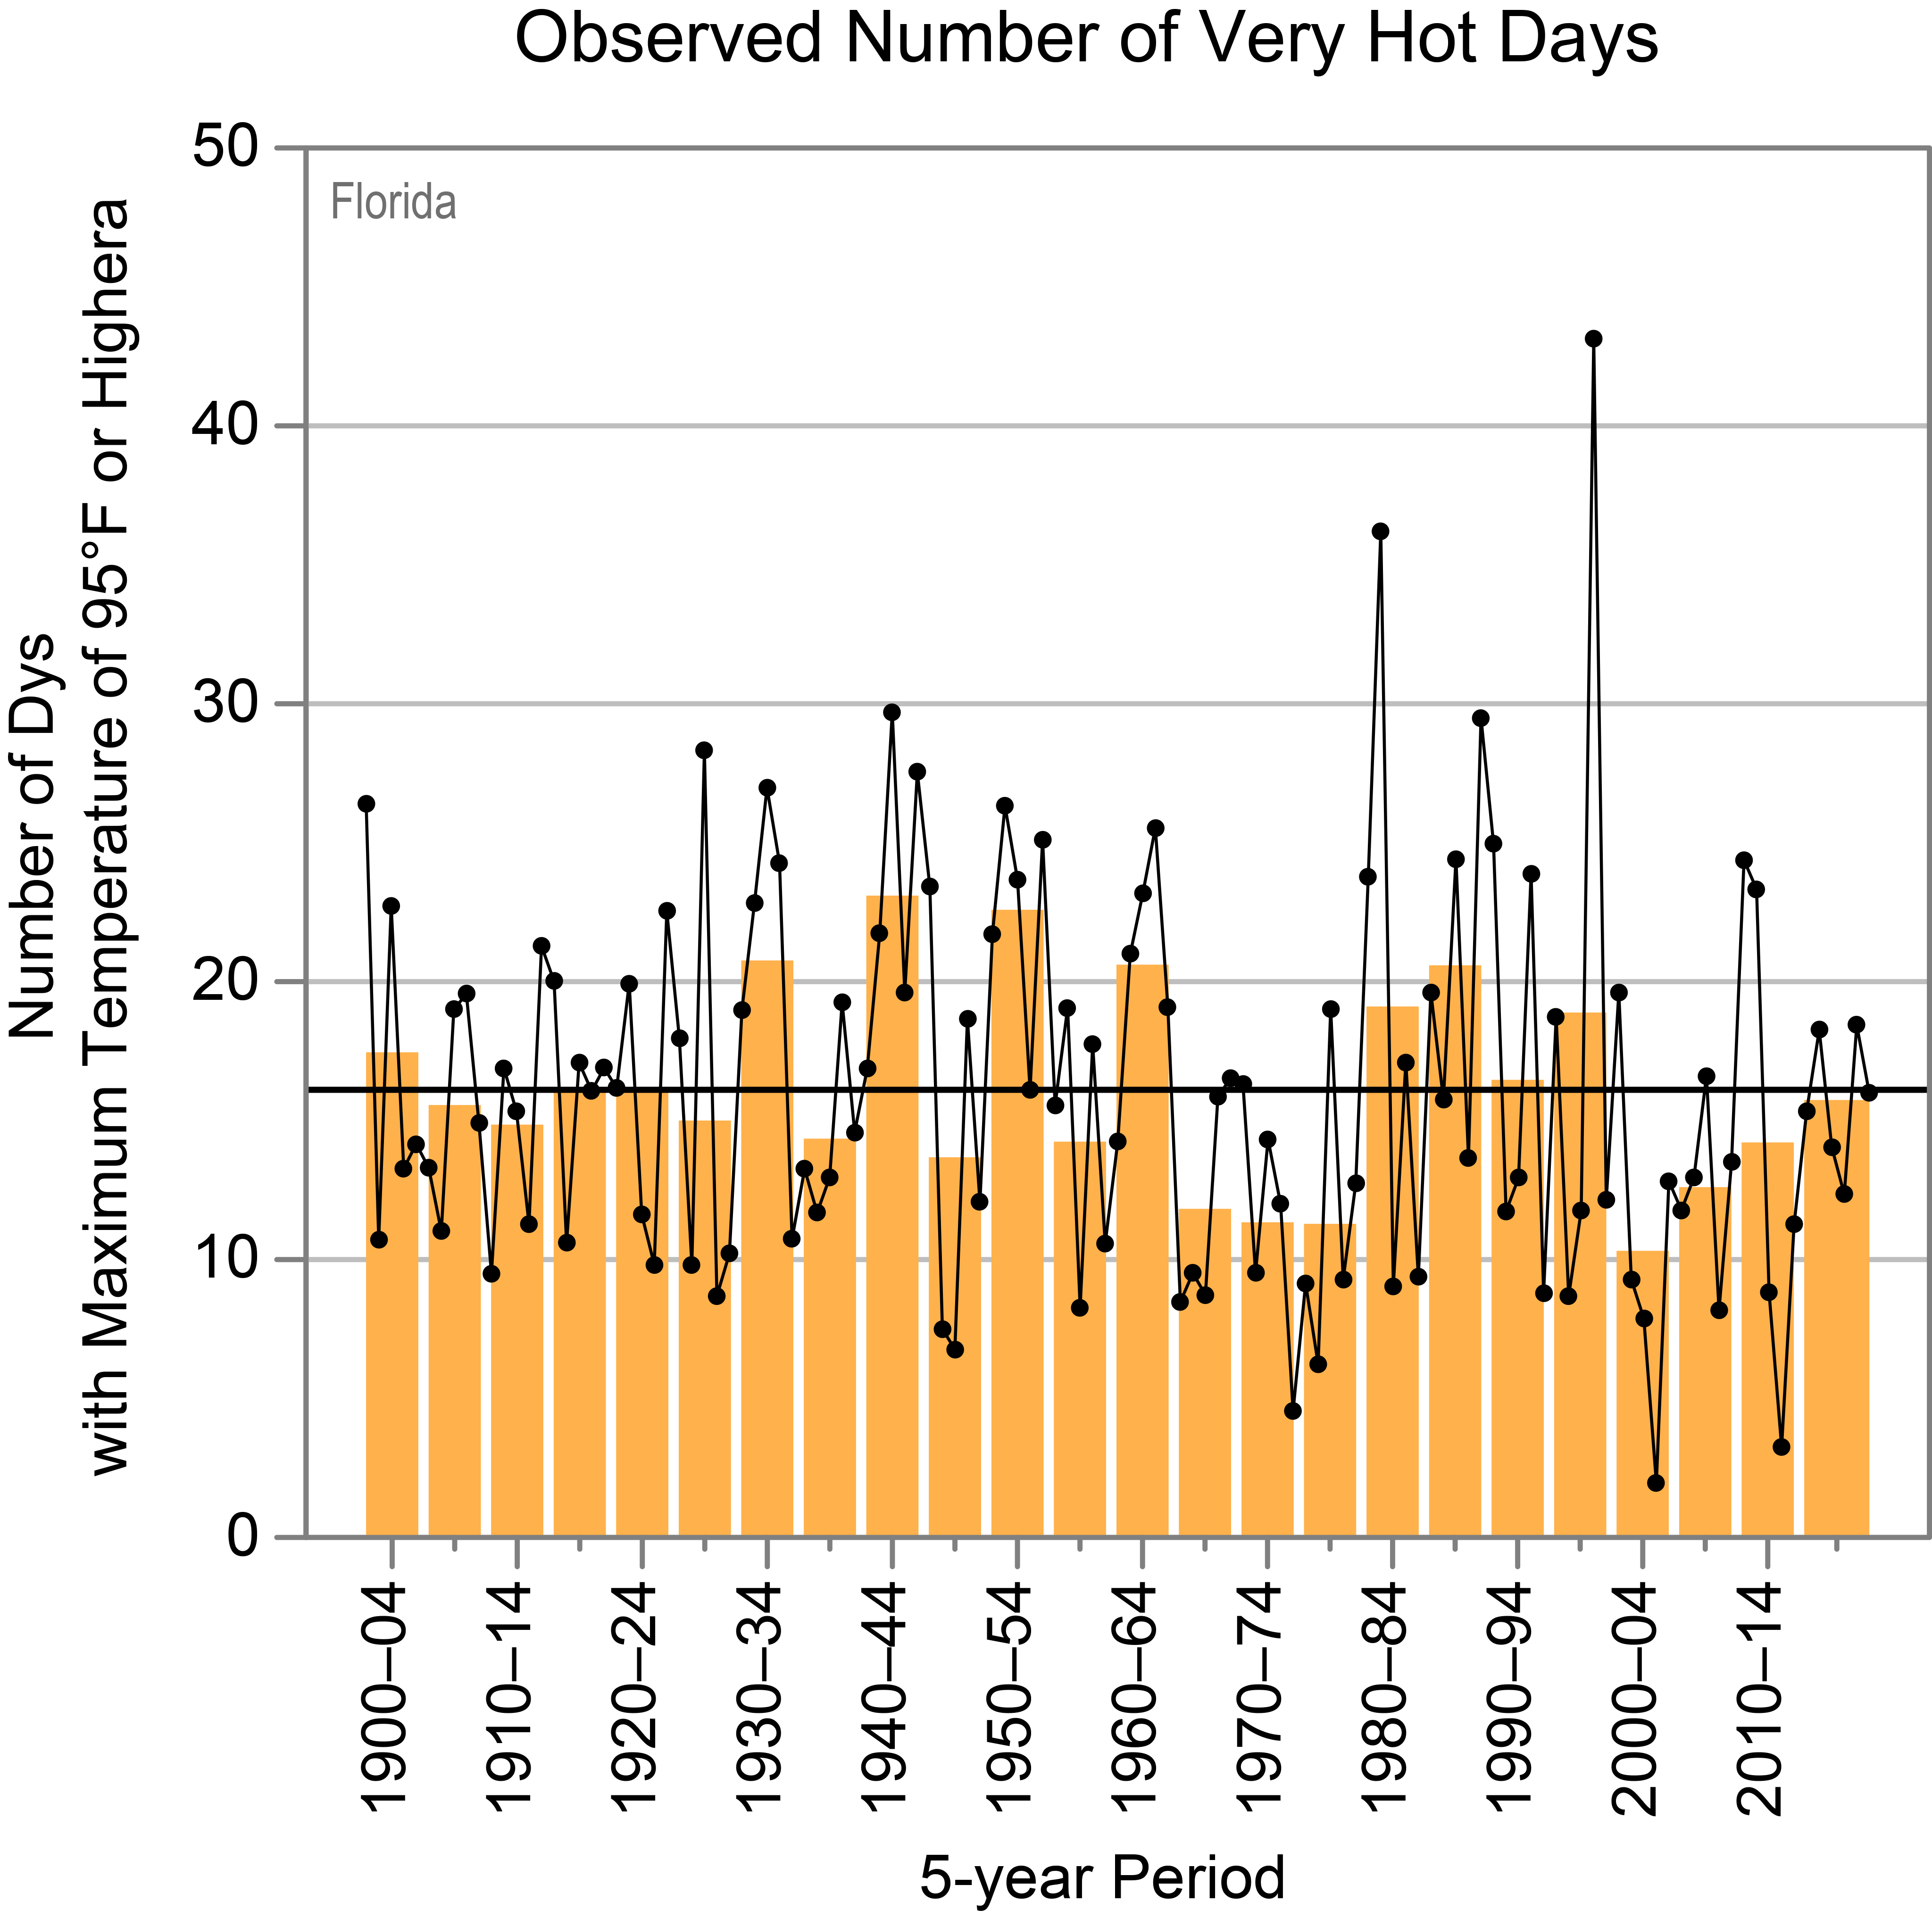
Average temperatures have risen about 2°F in Florida since 1900. However, this slight measured increase not been reflected by the number of “very hot” days (maximum temperatures of 95°F or higher) which have stayed the same or slightly declined in recent decades.2 The measured increase is largely due to two factors: an increase in the number of nights where minimum temperatures are 75°F or higher, and a decline in the number nights where minimums are at freezing temperatures or below.
Florida has experienced huge population growth over the past century, leading the nation in population growth since 2,000. More people, building more structures, using more energy, and requiring more roads and infrastructure, transforming undeveloped wetlands and fields into cities and subdivisions results in warming. Nighttime temperatures are driving the overall trend because they are most influenced by the urban heat island effect. Things like concrete, metal, brick, machinery like air conditioning units and vehicles, all contribute to an increase in local nighttime temperatures.3 This effect is especially pronounced in urban and suburban areas, with studies indicating that about 65 percent of warming in those areas can be attributed to urbanization itself.4
Figure 1: Observed number of very hot days since 1900. Dots are annual values. Orange bars show averages over a 5-year period, the last bar is a 6-year average. The horizontal black line shows the average of the entire period. Source: Chart from Runkkle et al. Florida State Climate Summary 2022, NOAA/NESDIS.
Precipitation:
Data show Florida has not experienced increases in either extreme precipitation events or average annual precipitation since the beginning of the 20th century.5
State-Specific Issues:
Hurricanes
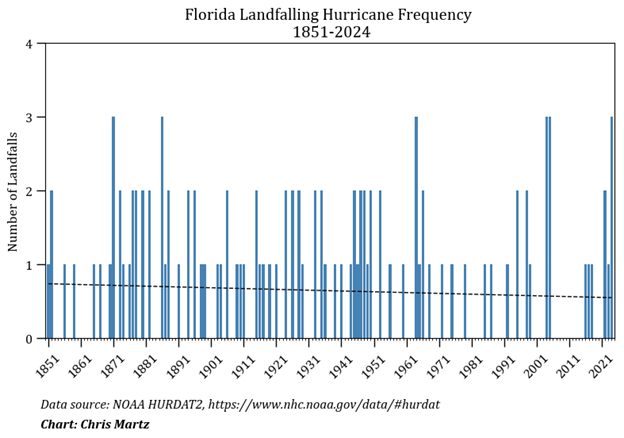
Globally, there is no trend in the frequency of hurricanes, tropical storms, or major hurricanes (Category 3 and above).6 Likewise, Florida has experienced no alarming hurricane trends over the past century, data indicates that there may be a decline in the average annual number of hurricanes making landfall there (see figure below). There has been no increase in hurricane severity or intensity over the same time period.7 From 2005 to 2016, Florida received an unprecedented zero hurricane landfalls.8
Figure 2: Data processed and chart made by Chris Martz, from NOAA HURDAT2 data: https://www.nhc.noaa.gov/data/#hurdat.
Sea level rise
As Florida has a shoreline that borders both the Gulf of America and the Atlantic, it has many official tide gauges which measure sea levels. They record varying rates of sea level rise, measuring from 2.38 to 6.38 millimeters per year of rise. The highest relative rate is recorded in Tampa and the lowest in Cedar Key.9 The Tampa station has a relatively short measurement period, and is outside of the average rate measured by other stations because Tampa suffers from extreme land subsidence (sinking) due to groundwater extraction.10 Actual sea level rise is nowhere near as extreme.11
In fact, land subsidence is common across Florida as coastal wetlands and mangrove swamps have been transformed into large urban areas. Simultaneously, groundwater has been pumped out of aquifers at an increasing rate, leading to land subsidence and large sink holes opening up.
Agriculture:
Florida is a leading producer of several major fruits and vegetables for the United States, but in particular the state leads in sugarcane and tomatoes, and is famous for the production of oranges.
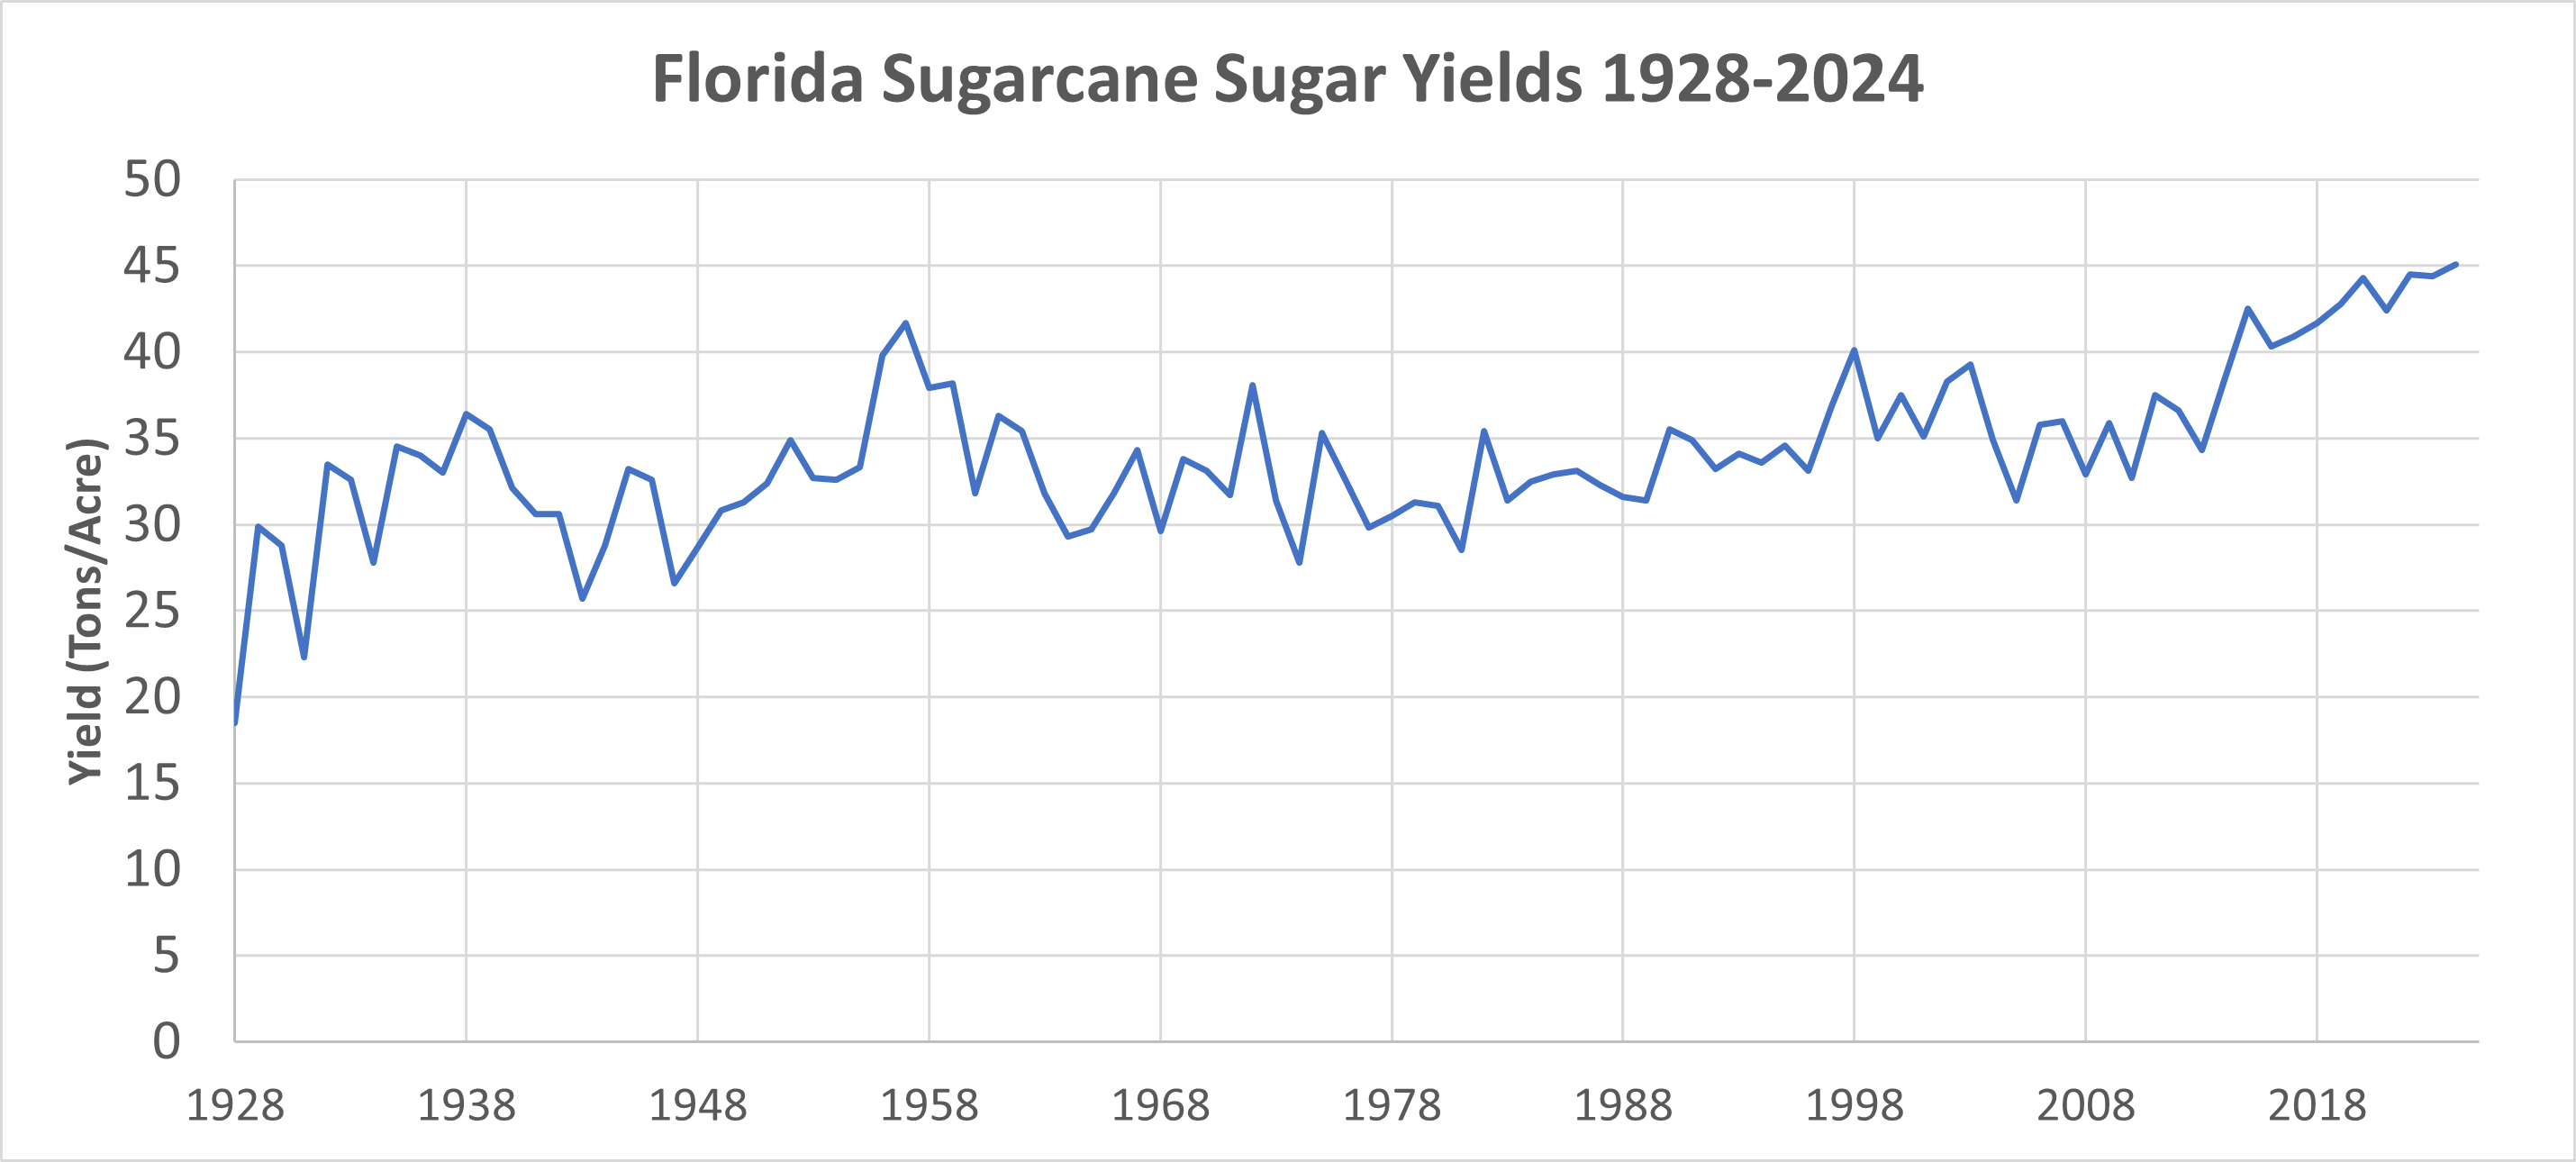
Crop survey data since 1928 show that sugarcane yields have increased by about 143 percent.12
Figure 3: Sugarcane sugar yields in tons per acre since 1928. Data from USDA QuickStats.
For tomatoes, data is limited, and while Florida is a leader in fresh-market tomatoes, the banning of methyl bromide in 2005 under the Montreal Protocol led to a decline in yield.13
Florida’s orange production has not been so fortunate. In recent years, impacts from hurricanes and multiple decades of an incurable disease called “citrus greening,” caused by an invasive insect, have resulted in falling yields and production.14 Due to this, acreage devoted to citrus groves has dropped as growers leave the industry. Before citrus greening was detected in the United States in 2005 and became widespread, Florida citrus had been seeing a relatively steady gain in yields.
Conclusion:
Florida faces weather related threats as well as other challenges like invasive species, however climate change is not damaging the state. There has been no increase in extreme heat, nor precipitation, and issues like sea level rise can be mitigated with coastal engineering.
J. Runkle, K. E. Kunkel, S. M. Champion, R. Frankson, B. C. Stewart, W. Sweet, and S. Rayne, Florida State Climate Summary 2022, NOAA Technical Report NESDIS 150-FL (Silver Spring, MD: NOAA/NESDIS, 2022). https://statesummaries.ncics.org/chapter/fl/
Spencer, Roy W., John R. Christy, and William D. Braswell. “Urban Heat Island Effects in U.S. Summer Surface Temperature Data, 1895–2023”, Journal of Applied Meteorology and Climatology (published online ahead of print 2025), doi: https://doi.org/10.1175/JAMC-D-23-0199.1
J. Runkle, K. E. Kunkel, S. M. Champion, R. Frankson, B. C. Stewart, W. Sweet, and S. Rayne, Florida State Climate Summary 2022.
“Global Tropical Cyclone Activity: Ryan Maue.” Global Tropical Cyclone Activity. Accessed August 21, 2025. https://climatlas.com/tropical/
Wu, Pei‐Chin, Meng (Matt) Wei, and Steven D’Hondt. “Subsidence in Coastal Cities throughout the World Observed by Insar.” Geophysical Research Letters 49, no. 7 (March 30, 2022). https://doi.org/10.1029/2022gl098477
Guan, Zhengfei, Trina Biswas, and Feng Wu. “FE1027/FE1027: The US Tomato Industry: An Overview of Production and Trade.” Ask IFAS – Powered by EDIS, January 21, 2025. https://edis.ifas.ufl.edu/publication/FE1027
Florida has seen no increase in the number of days with extreme heat.
The modest warming of the past century is driven entirely by higher lows at night, and declines in freezing nights, which is driven more by urbanization’s impact on temperature rather than climate change.
Florida has experienced no change in its precipitation trend.
Florida has experienced no change in hurricane landfall or intensity trends.
Short Summary:
Temperature Trends:
Florida is a humid, tropical state. The majority of the state is classified as “humid subtropical,” meaning it rarely drops below 0° F in winter, and is hot and humid in summer.1 The southernmost tip of the state gets enough rain that it can be classified as tropical rainforest, and the whole state receives quite a bit of precipitation in the summer months—famously in the afternoons or evenings—during the “rainy season” due to the state’s position surrounded by the Gulf and Atlantic Ocean.
Average temperatures have risen about 2°F in Florida since 1900. However, this slight measured increase not been reflected by the number of “very hot” days (maximum temperatures of 95°F or higher) which have stayed the same or slightly declined in recent decades.2 The measured increase is largely due to two factors: an increase in the number of nights where minimum temperatures are 75°F or higher, and a decline in the number nights where minimums are at freezing temperatures or below.
Florida has experienced huge population growth over the past century, leading the nation in population growth since 2,000. More people, building more structures, using more energy, and requiring more roads and infrastructure, transforming undeveloped wetlands and fields into cities and subdivisions results in warming. Nighttime temperatures are driving the overall trend because they are most influenced by the urban heat island effect. Things like concrete, metal, brick, machinery like air conditioning units and vehicles, all contribute to an increase in local nighttime temperatures.3 This effect is especially pronounced in urban and suburban areas, with studies indicating that about 65 percent of warming in those areas can be attributed to urbanization itself.4
Figure 1: Observed number of very hot days since 1900. Dots are annual values. Orange bars show averages over a 5-year period, the last bar is a 6-year average. The horizontal black line shows the average of the entire period. Source: Chart from Runkkle et al. Florida State Climate Summary 2022, NOAA/NESDIS.
Precipitation:
Data show Florida has not experienced increases in either extreme precipitation events or average annual precipitation since the beginning of the 20th century.5
State-Specific Issues:
Hurricanes
Globally, there is no trend in the frequency of hurricanes, tropical storms, or major hurricanes (Category 3 and above).6 Likewise, Florida has experienced no alarming hurricane trends over the past century, data indicates that there may be a decline in the average annual number of hurricanes making landfall there (see figure below). There has been no increase in hurricane severity or intensity over the same time period.7 From 2005 to 2016, Florida received an unprecedented zero hurricane landfalls.8
Figure 2: Data processed and chart made by Chris Martz, from NOAA HURDAT2 data: https://www.nhc.noaa.gov/data/#hurdat.
Sea level rise
As Florida has a shoreline that borders both the Gulf of America and the Atlantic, it has many official tide gauges which measure sea levels. They record varying rates of sea level rise, measuring from 2.38 to 6.38 millimeters per year of rise. The highest relative rate is recorded in Tampa and the lowest in Cedar Key.9 The Tampa station has a relatively short measurement period, and is outside of the average rate measured by other stations because Tampa suffers from extreme land subsidence (sinking) due to groundwater extraction.10 Actual sea level rise is nowhere near as extreme.11
In fact, land subsidence is common across Florida as coastal wetlands and mangrove swamps have been transformed into large urban areas. Simultaneously, groundwater has been pumped out of aquifers at an increasing rate, leading to land subsidence and large sink holes opening up.
Agriculture:
Florida is a leading producer of several major fruits and vegetables for the United States, but in particular the state leads in sugarcane and tomatoes, and is famous for the production of oranges.
Crop survey data since 1928 show that sugarcane yields have increased by about 143 percent.12
Figure 3: Sugarcane sugar yields in tons per acre since 1928. Data from USDA QuickStats.
For tomatoes, data is limited, and while Florida is a leader in fresh-market tomatoes, the banning of methyl bromide in 2005 under the Montreal Protocol led to a decline in yield.13
Florida’s orange production has not been so fortunate. In recent years, impacts from hurricanes and multiple decades of an incurable disease called “citrus greening,” caused by an invasive insect, have resulted in falling yields and production.14 Due to this, acreage devoted to citrus groves has dropped as growers leave the industry. Before citrus greening was detected in the United States in 2005 and became widespread, Florida citrus had been seeing a relatively steady gain in yields.
Conclusion:
Florida faces weather related threats as well as other challenges like invasive species, however climate change is not damaging the state. There has been no increase in extreme heat, nor precipitation, and issues like sea level rise can be mitigated with coastal engineering.
J. Runkle, K. E. Kunkel, S. M. Champion, R. Frankson, B. C. Stewart, W. Sweet, and S. Rayne, Florida State Climate Summary 2022, NOAA Technical Report NESDIS 150-FL (Silver Spring, MD: NOAA/NESDIS, 2022). https://statesummaries.ncics.org/chapter/fl/
Spencer, Roy W., John R. Christy, and William D. Braswell. “Urban Heat Island Effects in U.S. Summer Surface Temperature Data, 1895–2023”, Journal of Applied Meteorology and Climatology (published online ahead of print 2025), doi: https://doi.org/10.1175/JAMC-D-23-0199.1
J. Runkle, K. E. Kunkel, S. M. Champion, R. Frankson, B. C. Stewart, W. Sweet, and S. Rayne, Florida State Climate Summary 2022.
“Global Tropical Cyclone Activity: Ryan Maue.” Global Tropical Cyclone Activity. Accessed August 21, 2025. https://climatlas.com/tropical/
Wu, Pei‐Chin, Meng (Matt) Wei, and Steven D’Hondt. “Subsidence in Coastal Cities throughout the World Observed by Insar.” Geophysical Research Letters 49, no. 7 (March 30, 2022). https://doi.org/10.1029/2022gl098477
Guan, Zhengfei, Trina Biswas, and Feng Wu. “FE1027/FE1027: The US Tomato Industry: An Overview of Production and Trade.” Ask IFAS – Powered by EDIS, January 21, 2025. https://edis.ifas.ufl.edu/publication/FE1027
We use cookies to ensure that we give you the best experience on our website. If you continue to use this site we will assume that you are happy with it.