Since 1900, Ohio has experienced a decline in days with extreme heat.
A modest increase in precipitation in the winter and summer has led to improved crop production.
Neither drought nor wildfires have increased during the recent period of modest warming.
Short Summary
Temperature Trends:
Ohio is dominated by a humid continental climate, according to Köppen classification, meaning it has mild-to-hot, humid summers and cold, snowy winters.1
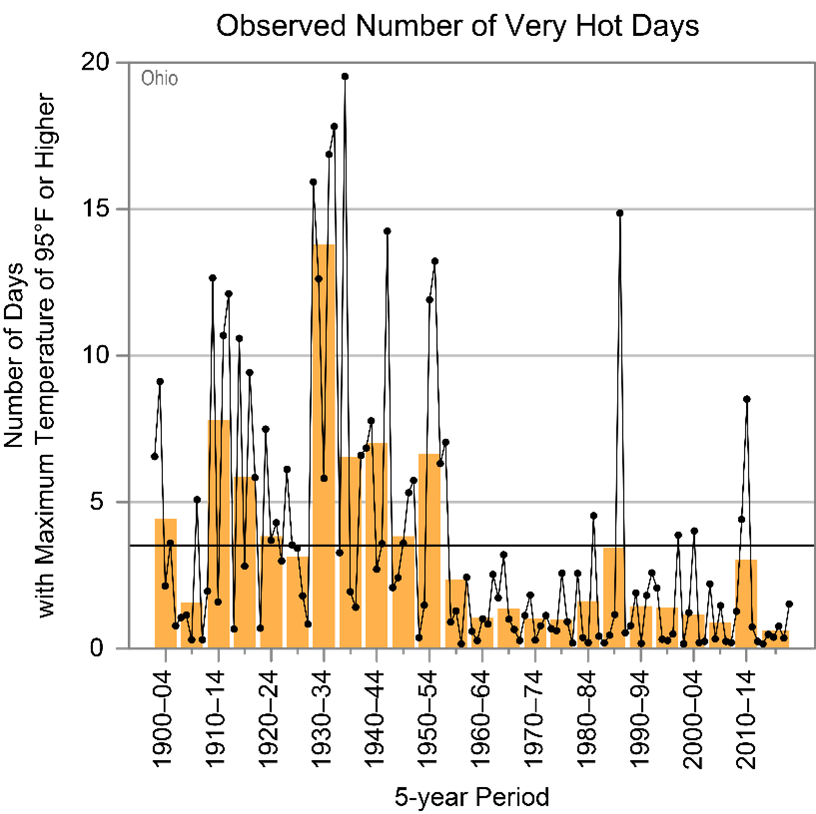
Average temperatures have modestly increased in Ohio since 1900, by about 1.5°F. However, this rise is not accompanied by an increase in “very hot” days, or days with maximum temperatures of 95°F or higher.2 Actually, very hot days have sharply declined since the 1930s and 1940s. The rise in average temperatures is likely explained by the slight decrease in measured “very cold” nights, or nights that hit 0°F or lower, since the late 1970s, and a slight increase in the number of warm nights since the 1960s.
Figure 1: Observed number of very hot days in Ohio since 1900. Dots are annual values. Orange bars show averages over a 5-year period, the last bar is a 6-year average. The horizontal black line shows the average of the entire period. Chart from Frankson, R., K.E. Kunkel, S.M. Champion, and D.R. Easterling, 2022: Ohio State Climate Summary 2022
An increase in the number of warm nights, without corresponding increases in daytime highs, is an indicator that what is being measured is not being driven by greenhouse gas emissions but rather the urban heat island effect influencing station measurements. During the day, energy from the sun is absorbed by surfaces like concrete, which hold on to heat longer than natural environments, and release heat well into the night. Columbus, Ohio is among the fastest growing cities in the Midwest. Recent research suggests the urban heat island effect might be responsible for up to 65 percent of observed warming in urban and suburban areas.3
Precipitation:
Average precipitation has increased slightly in Ohio since the 1990s, with most of that increase occurring in the winter months.4 Despite this fact, there has been no apparent increase in major floods. River gage data for the Scioto River in Columbus, and the Ohio River in Cincinnati, show that river crests are not getting higher.5,6 The highest floodwaters recorded on the Ohio River in Cincinnati occurred in 1937, and 1959 for the Scioto in Columbus.
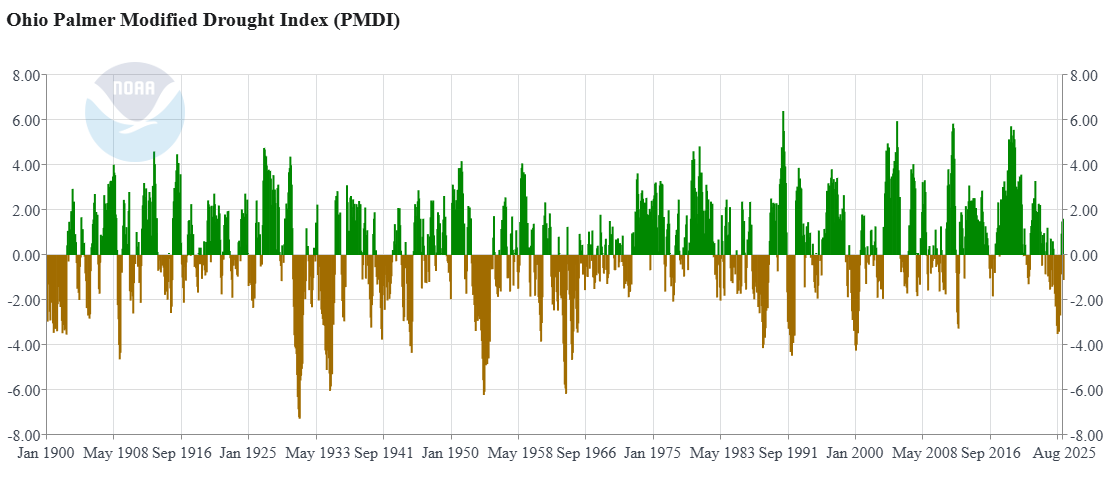
Drought has not become more frequent or intense in Ohio, according to official government data.7
Figure 2: Palmer Modified Drought Index for Ohio, 1900–present. Brown (negative) values show drought conditions; green (positive) values show wet conditions. Chart from NOAA National Centers for Environmental information Statewide Time Series.
State-Specific Issues:
Ohio is a temperate state, experiencing the same types of extreme weather as other midwestern states, including wildfires, snowstorms, and thunderstorms that sometimes spawn tornadoes.
Wildfires
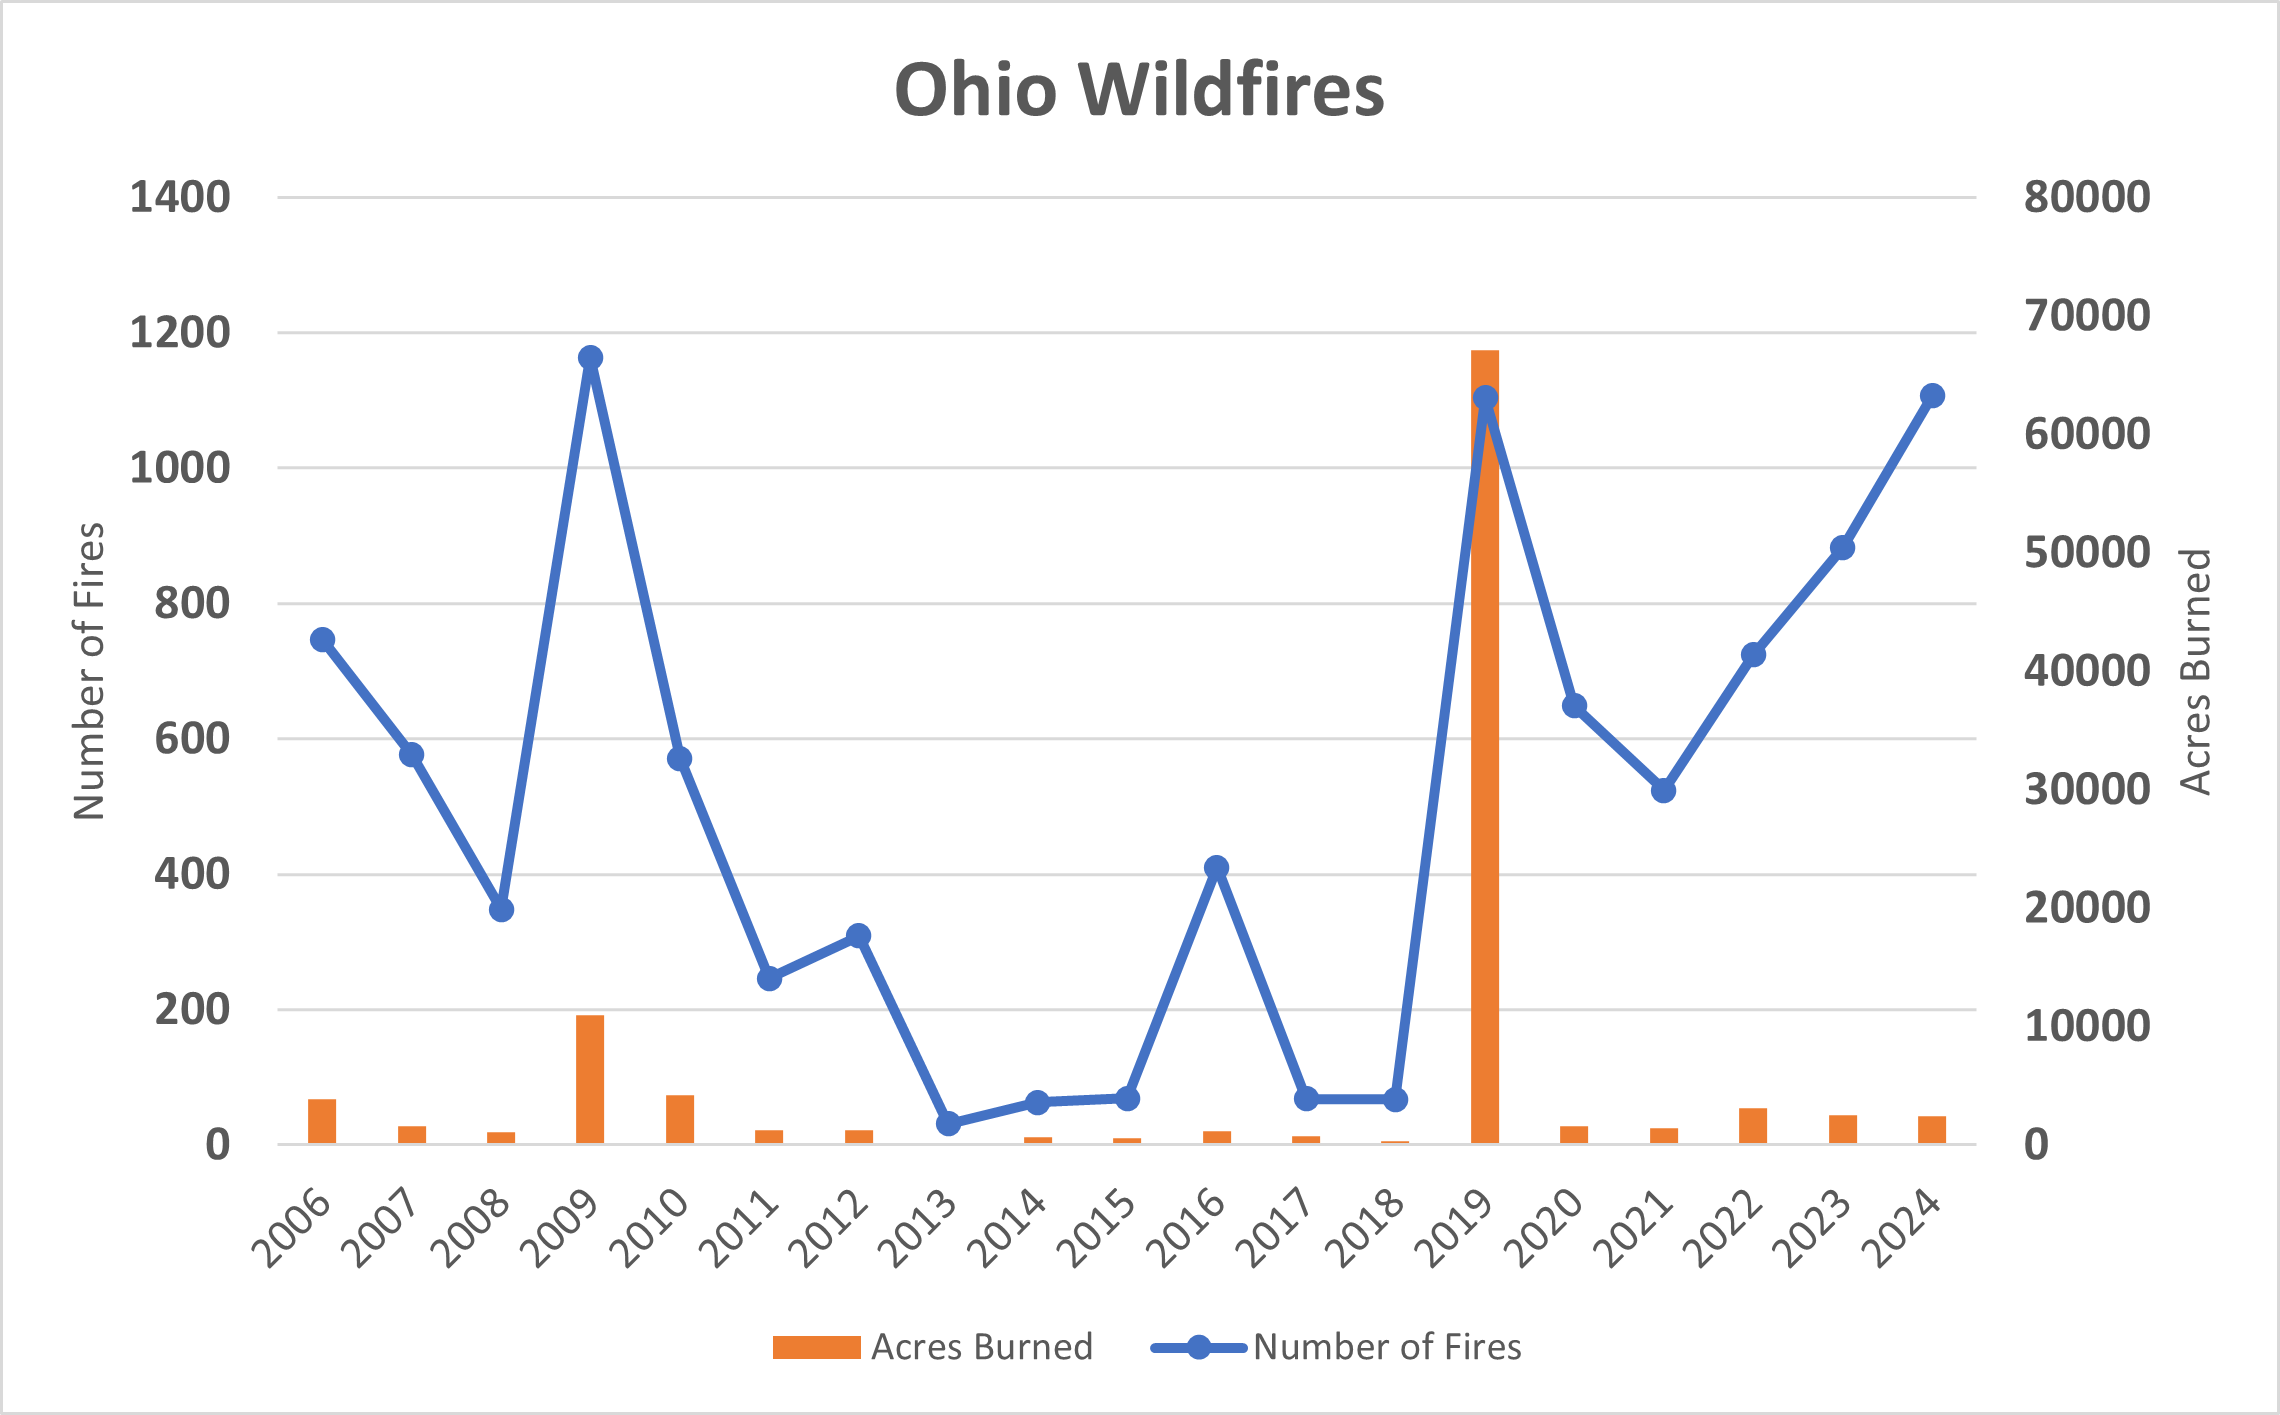
Consistent recordkeeping specifically for wildfires in Ohio began in 2006. Since then, there has been no measured trend of increases in wildfire occurrences or acreage burned.8 The number of wildfires varies widely from one year to the next. For the United States as a whole, the number of wildfires and acreage lost to them have declined considerably since the early twentieth century.
Figure 3: Wildfires in Ohio from 2006 – 2024. Data from the National Interagency Coordination Center.
Snow
Seasonal snow accumulation trends vary widely across the state from one city to the next, with a strong increase of 36 percent in Youngstown since the 1970s, almost no change at all in Columbus, and a 20 percent decline in Dayton.9 There is no consistent trend for the state of either increased or decreased snow, which would suggest a link to climate change.
Tornadoes
Ohio is vulnerable to severe thunderstorms, which often produce tornadoes. While there have been more total tornadoes reported in Ohio in the past few years, the number of strong tornadoes (EF2+) has not seen a similar increasing trend.10 The rise in reported tornadoes is partially due to improved systems for identifying and tracking tornadoes.
Agriculture:
Ohio is an agriculturally rich state with vast acres of prime farmland. By far, the two most valuable and widely planted crops in Ohio are soybeans and corn.
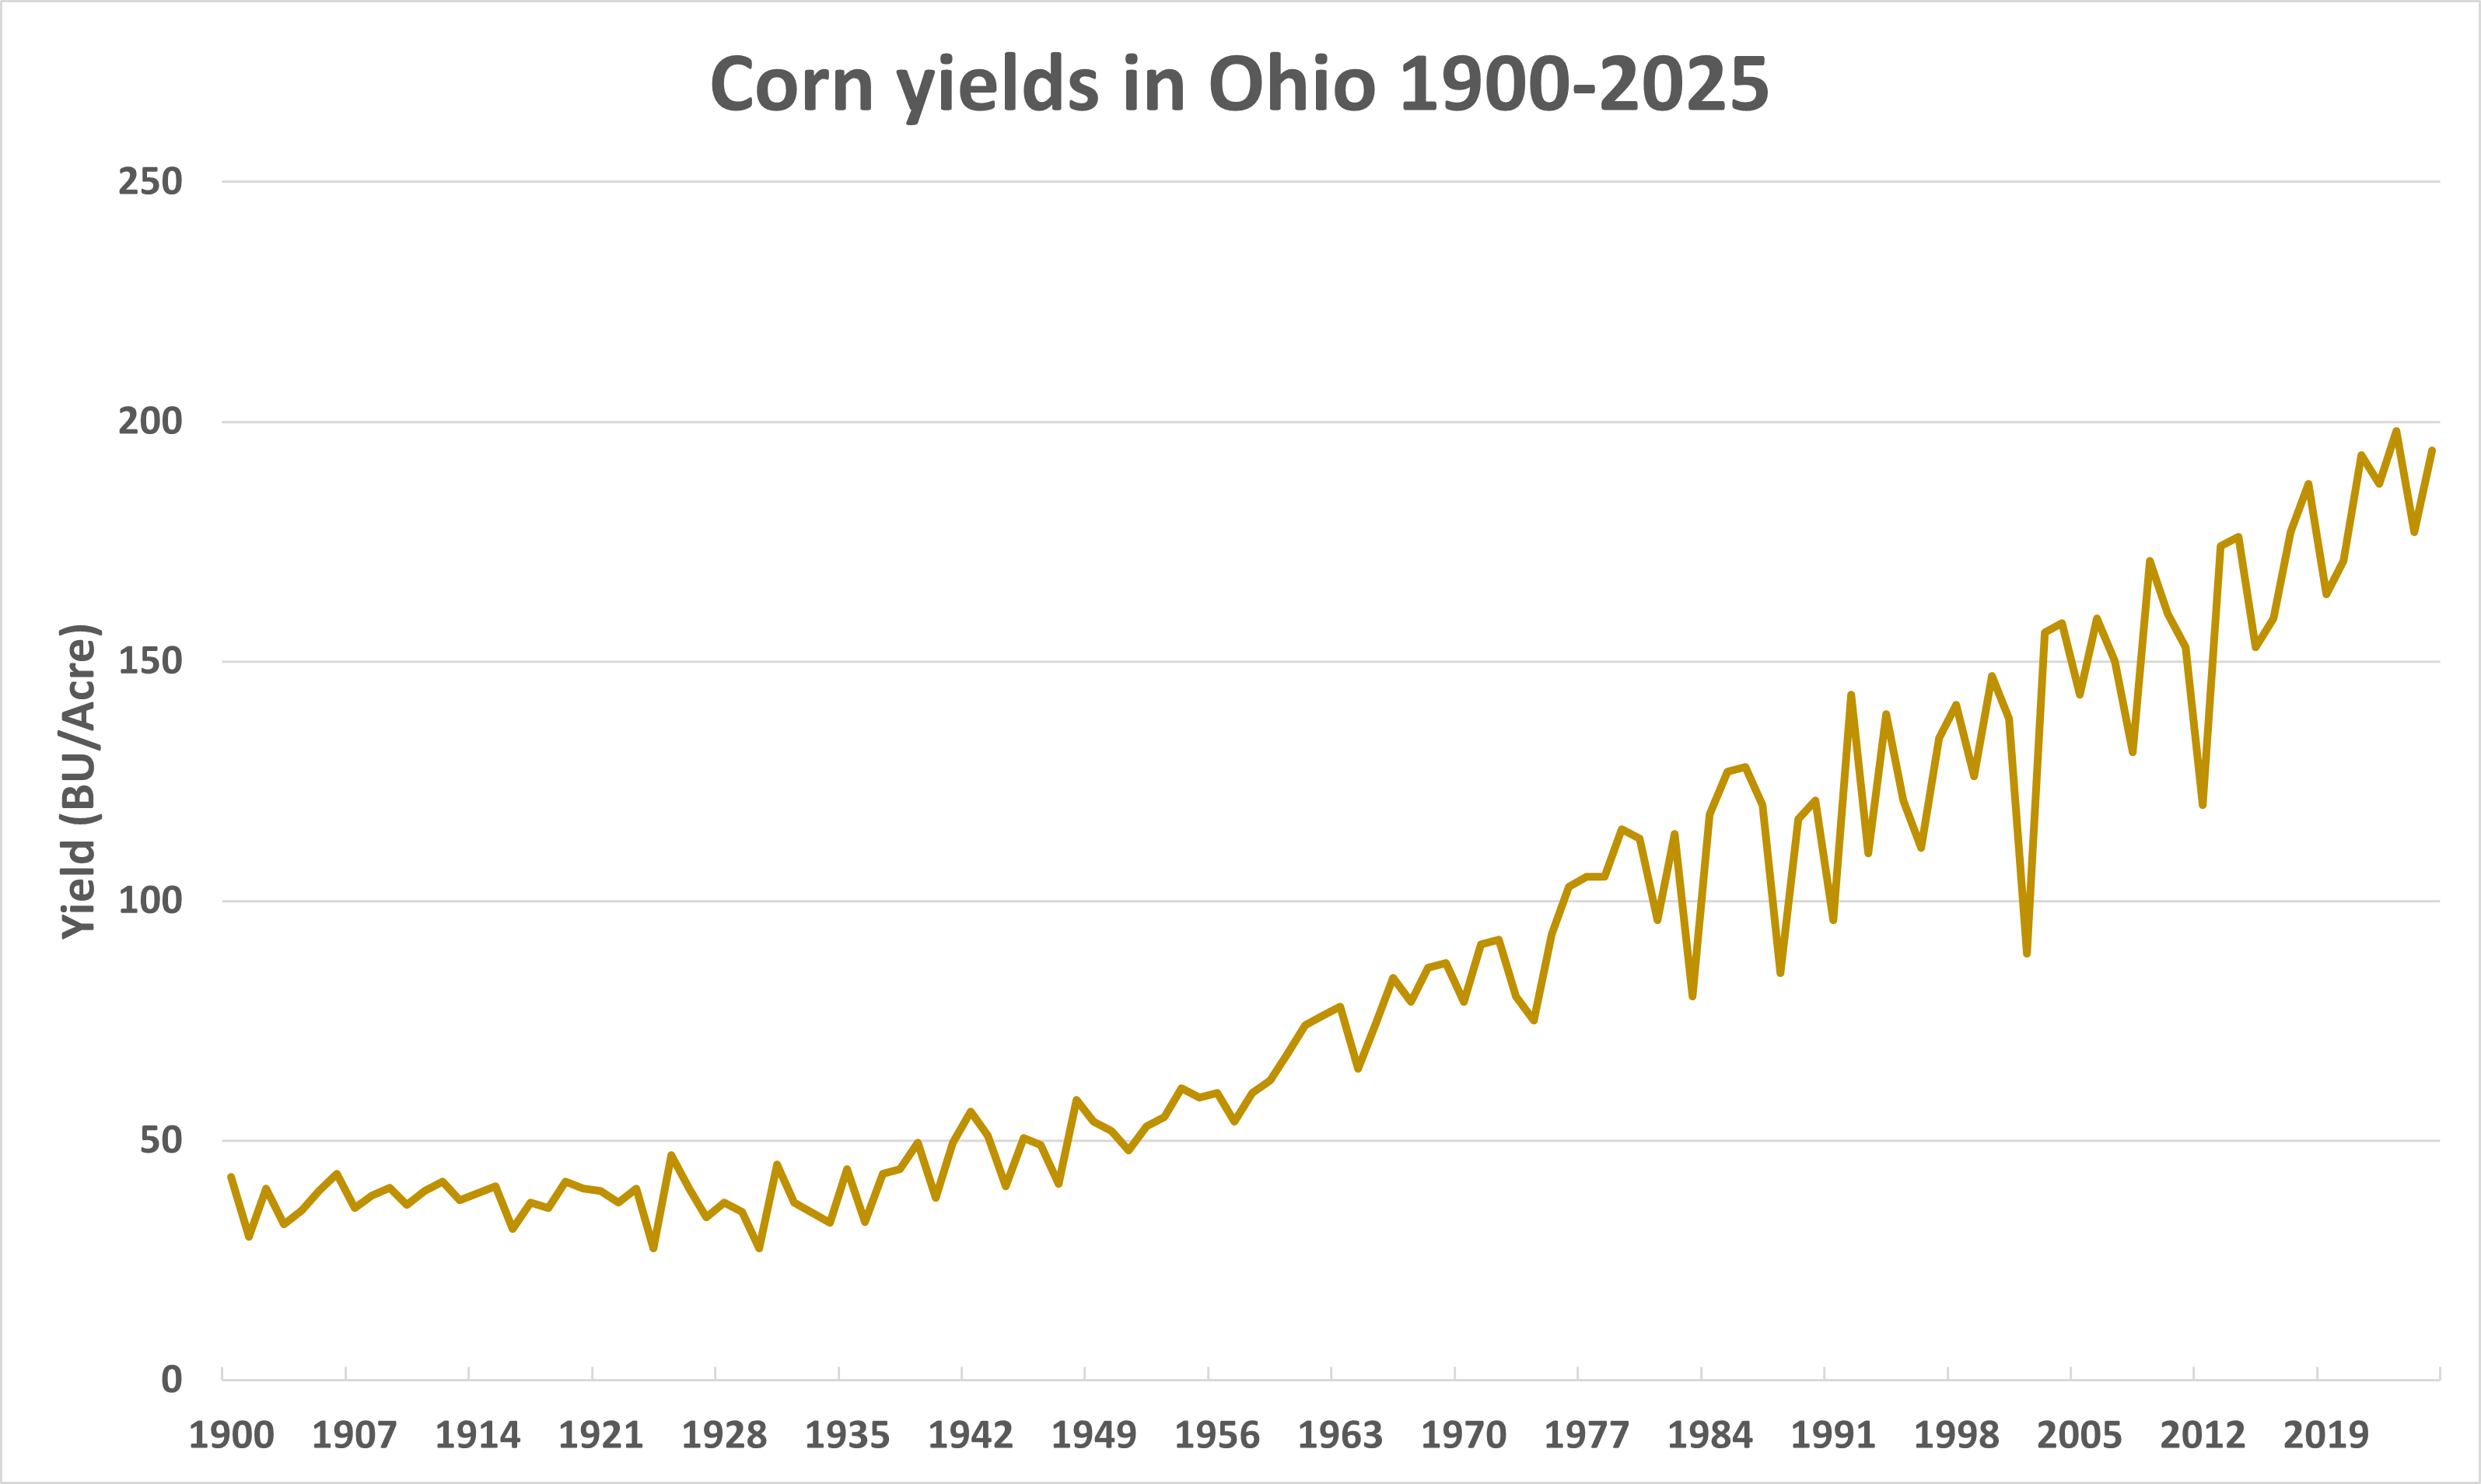
U.S. Department of Agriculture data show that Ohio’s soybean yields have increased substantially since the 1920s, up 386 percent.11 There is an even longer dataset for corn, which saw yields increase 356 percent since 1900.12 Ohio’s most recent all-time high records for yields of corn and soybeans were both set in 2023.
Figure 4: Yearly corn yield survey data, 1900-2025, for Ohio. Data from USDA Quick Stats.]
Conclusion:
Ohio is not experiencing dangerous effects from the past hundred years of modest climate change. There is no increase in dangerously hot days, but there is a decrease in dangerously cold days. There has been no identifiable increase in extreme weather. Also, increased precipitation and higher CO2 concentrations have significantly boosted corn and soybean yields.
Frankson, R., K. E. Kunkel, S. M. Champion, and D. R. Easterling. 2022. Ohio State Climate Summary 2022. NOAA Technical Report NESDIS 150-OH. Silver Spring, MD: NOAA/NESDIS. https://statesummaries.ncics.org/chapter/oh/
Spencer, Roy W., John R. Christy, and William D. Braswell. “Urban Heat Island Effects in U.S. Summer Surface Temperature Data, 1895–2023”, Journal of Applied Meteorology and Climatology (published online ahead of print 2025), doi: https://doi.org/10.1175/JAMC-D-23-0199.1
Frankson, R., K. E. Kunkel, S. M. Champion, and D. R. Easterling. 2022. Ohio State Climate Summary 2022.
Since 1900, Ohio has experienced a decline in days with extreme heat.
A modest increase in precipitation in the winter and summer has led to improved crop production.
Neither drought nor wildfires have increased during the recent period of modest warming.
Short Summary
Temperature Trends:
Ohio is dominated by a humid continental climate, according to Köppen classification, meaning it has mild-to-hot, humid summers and cold, snowy winters.1
Average temperatures have modestly increased in Ohio since 1900, by about 1.5°F. However, this rise is not accompanied by an increase in “very hot” days, or days with maximum temperatures of 95°F or higher.2 Actually, very hot days have sharply declined since the 1930s and 1940s. The rise in average temperatures is likely explained by the slight decrease in measured “very cold” nights, or nights that hit 0°F or lower, since the late 1970s, and a slight increase in the number of warm nights since the 1960s.
Figure 1: Observed number of very hot days in Ohio since 1900. Dots are annual values. Orange bars show averages over a 5-year period, the last bar is a 6-year average. The horizontal black line shows the average of the entire period. Chart from Frankson, R., K.E. Kunkel, S.M. Champion, and D.R. Easterling, 2022: Ohio State Climate Summary 2022
An increase in the number of warm nights, without corresponding increases in daytime highs, is an indicator that what is being measured is not being driven by greenhouse gas emissions but rather the urban heat island effect influencing station measurements. During the day, energy from the sun is absorbed by surfaces like concrete, which hold on to heat longer than natural environments, and release heat well into the night. Columbus, Ohio is among the fastest growing cities in the Midwest. Recent research suggests the urban heat island effect might be responsible for up to 65 percent of observed warming in urban and suburban areas.3
Precipitation:
Average precipitation has increased slightly in Ohio since the 1990s, with most of that increase occurring in the winter months.4 Despite this fact, there has been no apparent increase in major floods. River gage data for the Scioto River in Columbus, and the Ohio River in Cincinnati, show that river crests are not getting higher.5,6 The highest floodwaters recorded on the Ohio River in Cincinnati occurred in 1937, and 1959 for the Scioto in Columbus.
Drought has not become more frequent or intense in Ohio, according to official government data.7
Figure 2: Palmer Modified Drought Index for Ohio, 1900–present. Brown (negative) values show drought conditions; green (positive) values show wet conditions. Chart from NOAA National Centers for Environmental information Statewide Time Series.
State-Specific Issues:
Ohio is a temperate state, experiencing the same types of extreme weather as other midwestern states, including wildfires, snowstorms, and thunderstorms that sometimes spawn tornadoes.
Wildfires
Consistent recordkeeping specifically for wildfires in Ohio began in 2006. Since then, there has been no measured trend of increases in wildfire occurrences or acreage burned.8 The number of wildfires varies widely from one year to the next. For the United States as a whole, the number of wildfires and acreage lost to them have declined considerably since the early twentieth century.
Figure 3: Wildfires in Ohio from 2006 – 2024. Data from the National Interagency Coordination Center.
Snow
Seasonal snow accumulation trends vary widely across the state from one city to the next, with a strong increase of 36 percent in Youngstown since the 1970s, almost no change at all in Columbus, and a 20 percent decline in Dayton.9 There is no consistent trend for the state of either increased or decreased snow, which would suggest a link to climate change.
Tornadoes
Ohio is vulnerable to severe thunderstorms, which often produce tornadoes. While there have been more total tornadoes reported in Ohio in the past few years, the number of strong tornadoes (EF2+) has not seen a similar increasing trend.10 The rise in reported tornadoes is partially due to improved systems for identifying and tracking tornadoes.
Agriculture:
Ohio is an agriculturally rich state with vast acres of prime farmland. By far, the two most valuable and widely planted crops in Ohio are soybeans and corn.
U.S. Department of Agriculture data show that Ohio’s soybean yields have increased substantially since the 1920s, up 386 percent.11 There is an even longer dataset for corn, which saw yields increase 356 percent since 1900.12 Ohio’s most recent all-time high records for yields of corn and soybeans were both set in 2023.
Figure 4: Yearly corn yield survey data, 1900-2025, for Ohio. Data from USDA Quick Stats.]
Conclusion:
Ohio is not experiencing dangerous effects from the past hundred years of modest climate change. There is no increase in dangerously hot days, but there is a decrease in dangerously cold days. There has been no identifiable increase in extreme weather. Also, increased precipitation and higher CO2 concentrations have significantly boosted corn and soybean yields.
Frankson, R., K. E. Kunkel, S. M. Champion, and D. R. Easterling. 2022. Ohio State Climate Summary 2022. NOAA Technical Report NESDIS 150-OH. Silver Spring, MD: NOAA/NESDIS. https://statesummaries.ncics.org/chapter/oh/
Spencer, Roy W., John R. Christy, and William D. Braswell. “Urban Heat Island Effects in U.S. Summer Surface Temperature Data, 1895–2023”, Journal of Applied Meteorology and Climatology (published online ahead of print 2025), doi: https://doi.org/10.1175/JAMC-D-23-0199.1
Frankson, R., K. E. Kunkel, S. M. Champion, and D. R. Easterling. 2022. Ohio State Climate Summary 2022.
We use cookies to ensure that we give you the best experience on our website. If you continue to use this site we will assume that you are happy with it.