A slight trend towards more annual precipitation is benefiting crop production.
There are no trends towards more frequent or severe wildfires, hurricanes, or tornado outbreaks.
Major crops, like cotton and hay, have experienced increased yields.
Short Summary:
Temperature Trends:
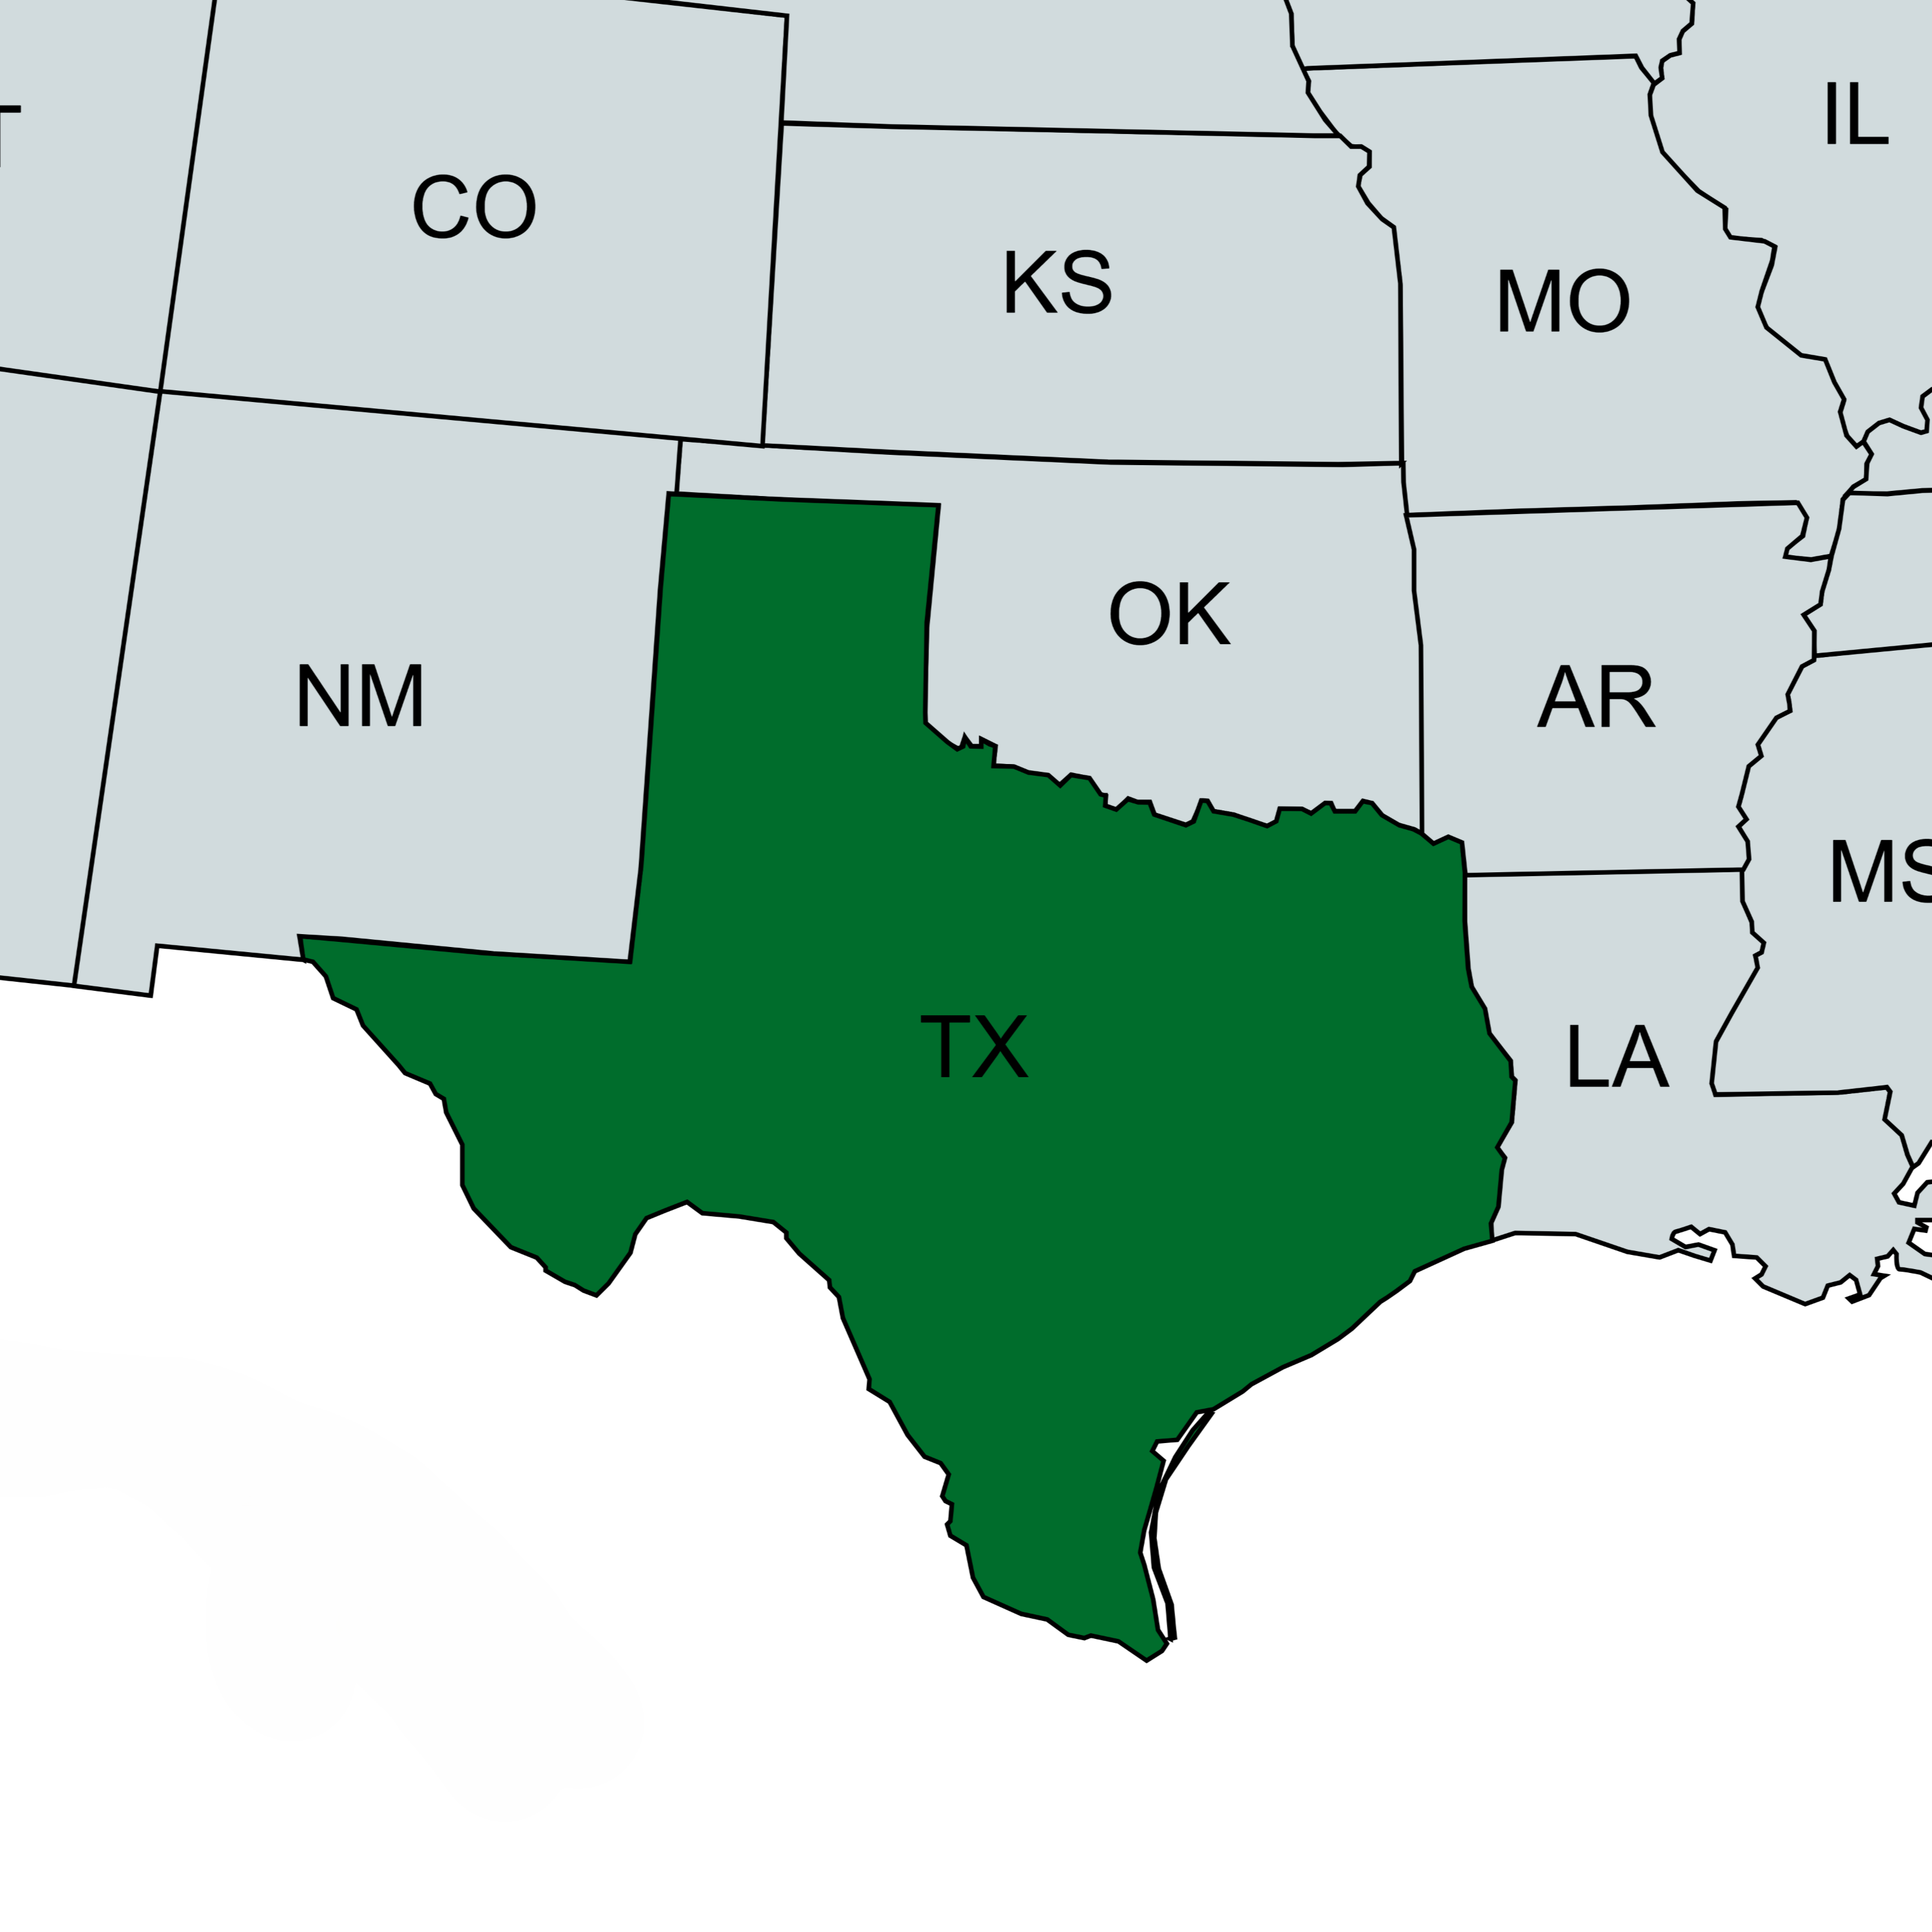
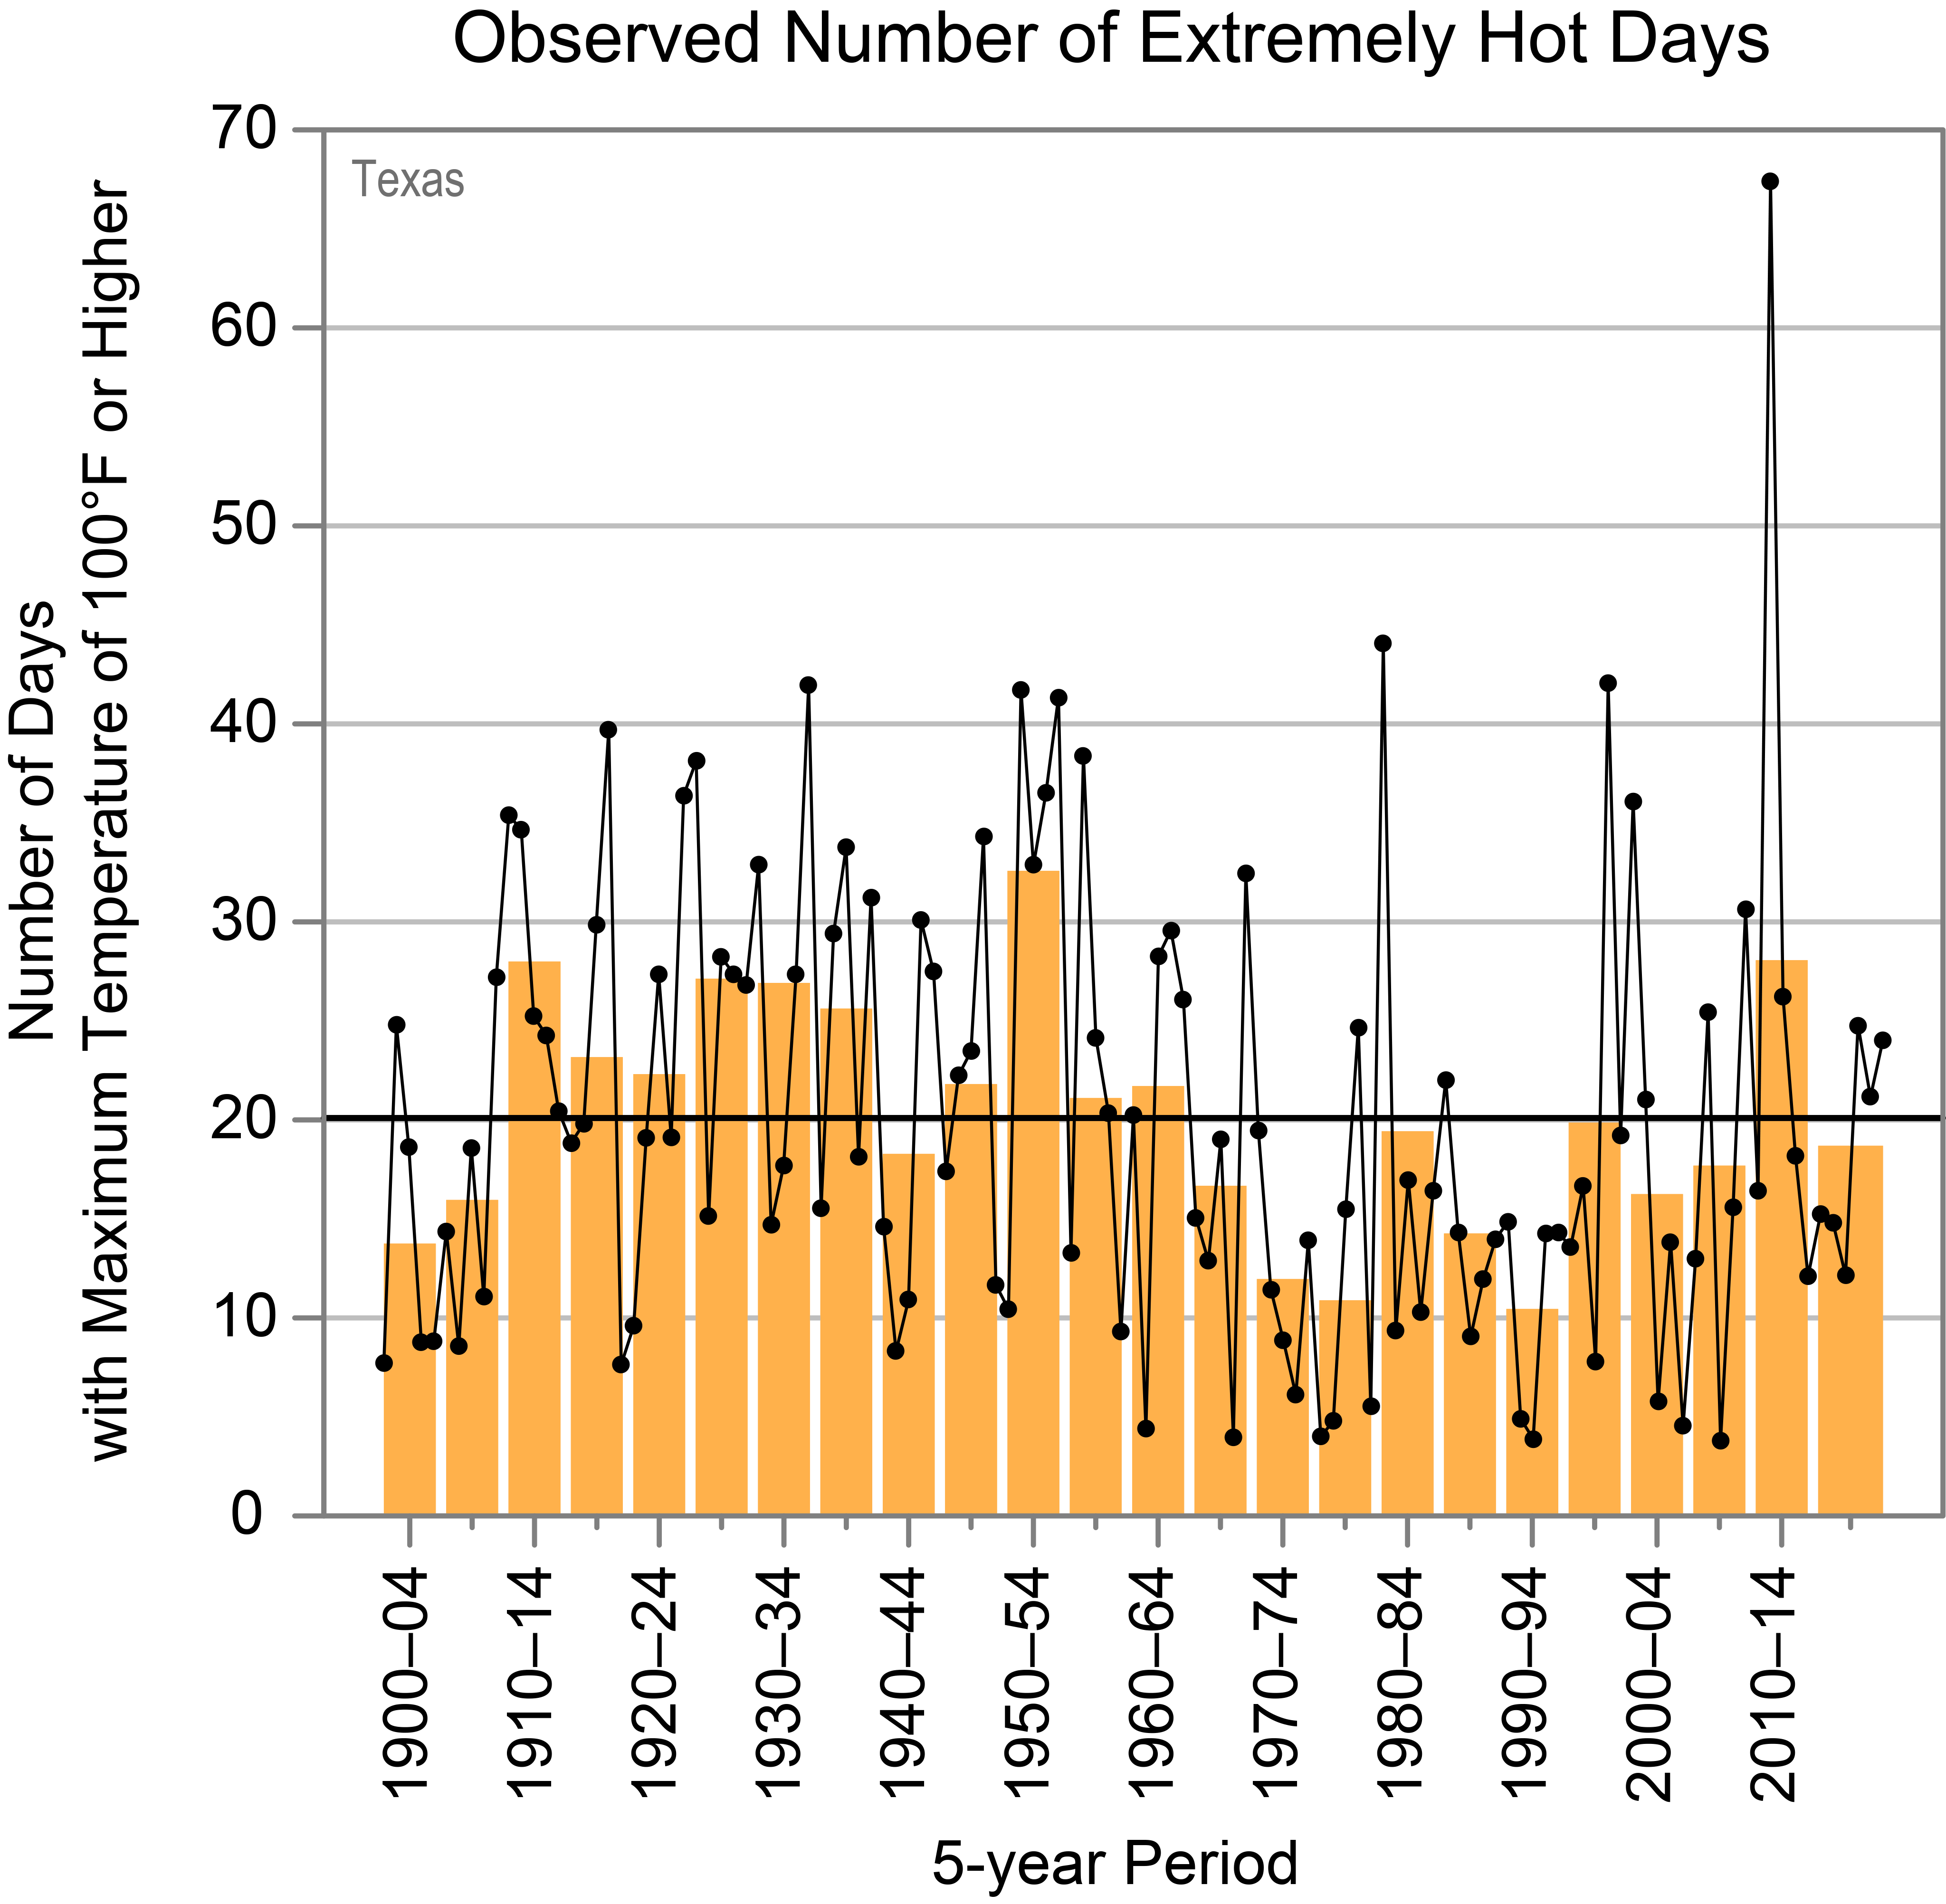
Texas, the second-largest state in the United States, is dominated largely by a humid, subtropical climate in the Eastern part of the state, and an arid, hot climate in its Western region, including some desert.1 This being the case, hot weather is the norm across all regions of Texas. However, even as the global average temperature has risen slightly, Texas has not experienced any sustained increase in the number of “extremely hot” days – defined by the National Oceanic and Atmospheric Administration as days with high temperatures reaching 100°F. Measured data show such days of extreme heat occur in Texas slightly less frequently at present than they did from the 1920s to 1950s.2
Figure 1: Observed number of very hot days since 1900. Dots are annual values. Blue bars show averages over a 5-year period, though the last bar is a 6-year average. The horizontal black line shows the average of the entire period. Chart from Jennifer Runkle and Kenneth E. Kunkel, State Climate Summaries 2022: Texas, National Centers for Environmental Information.
Average temperatures in Texas have risen nearly 1.5°F since 1900, but most of this is driven by warmer nighttime low temperatures, not daytime highs.3 These nighttime temperatures are heavily influenced by the Urban Heat Island Effect, particularly in areas that have seen substantial urban sprawl. Texas population growth has outpaced all U.S. states in recent years, and the growth of metropolitan areas like Dallas-Fort Worth, Houston, and Austin each saw more than 500,000 new residents from 2010 to 2022.4 Rising populations bring development of houses, streets, businesses, and associated infrastructure. Materials like concrete and steel, as well as vehicles, air conditioning, heating unit exhaust, and other machinery contribute to the increase in local urban and suburban nighttime temperatures.5
Precipitation:
Much of Texas is arid, but the state has seen a gradual, slight overall increase in average annual precipitation.6 Recent periods of drought are within historical norms for the past century, with the worst, long-term droughts in the modern record having occurred in the 1950s, 70 years of global warming ago.7
State-Specific Issues:
Texas is a big state in the Southwest and has a long stretch of coastline along the Gulf of America, making tornadoes, wildfires, and hurricanes more likely. The northeastern and central part of the state are also part of a large part of the continental United States commonly referred to as “Tornado Alley.”
Wildfires
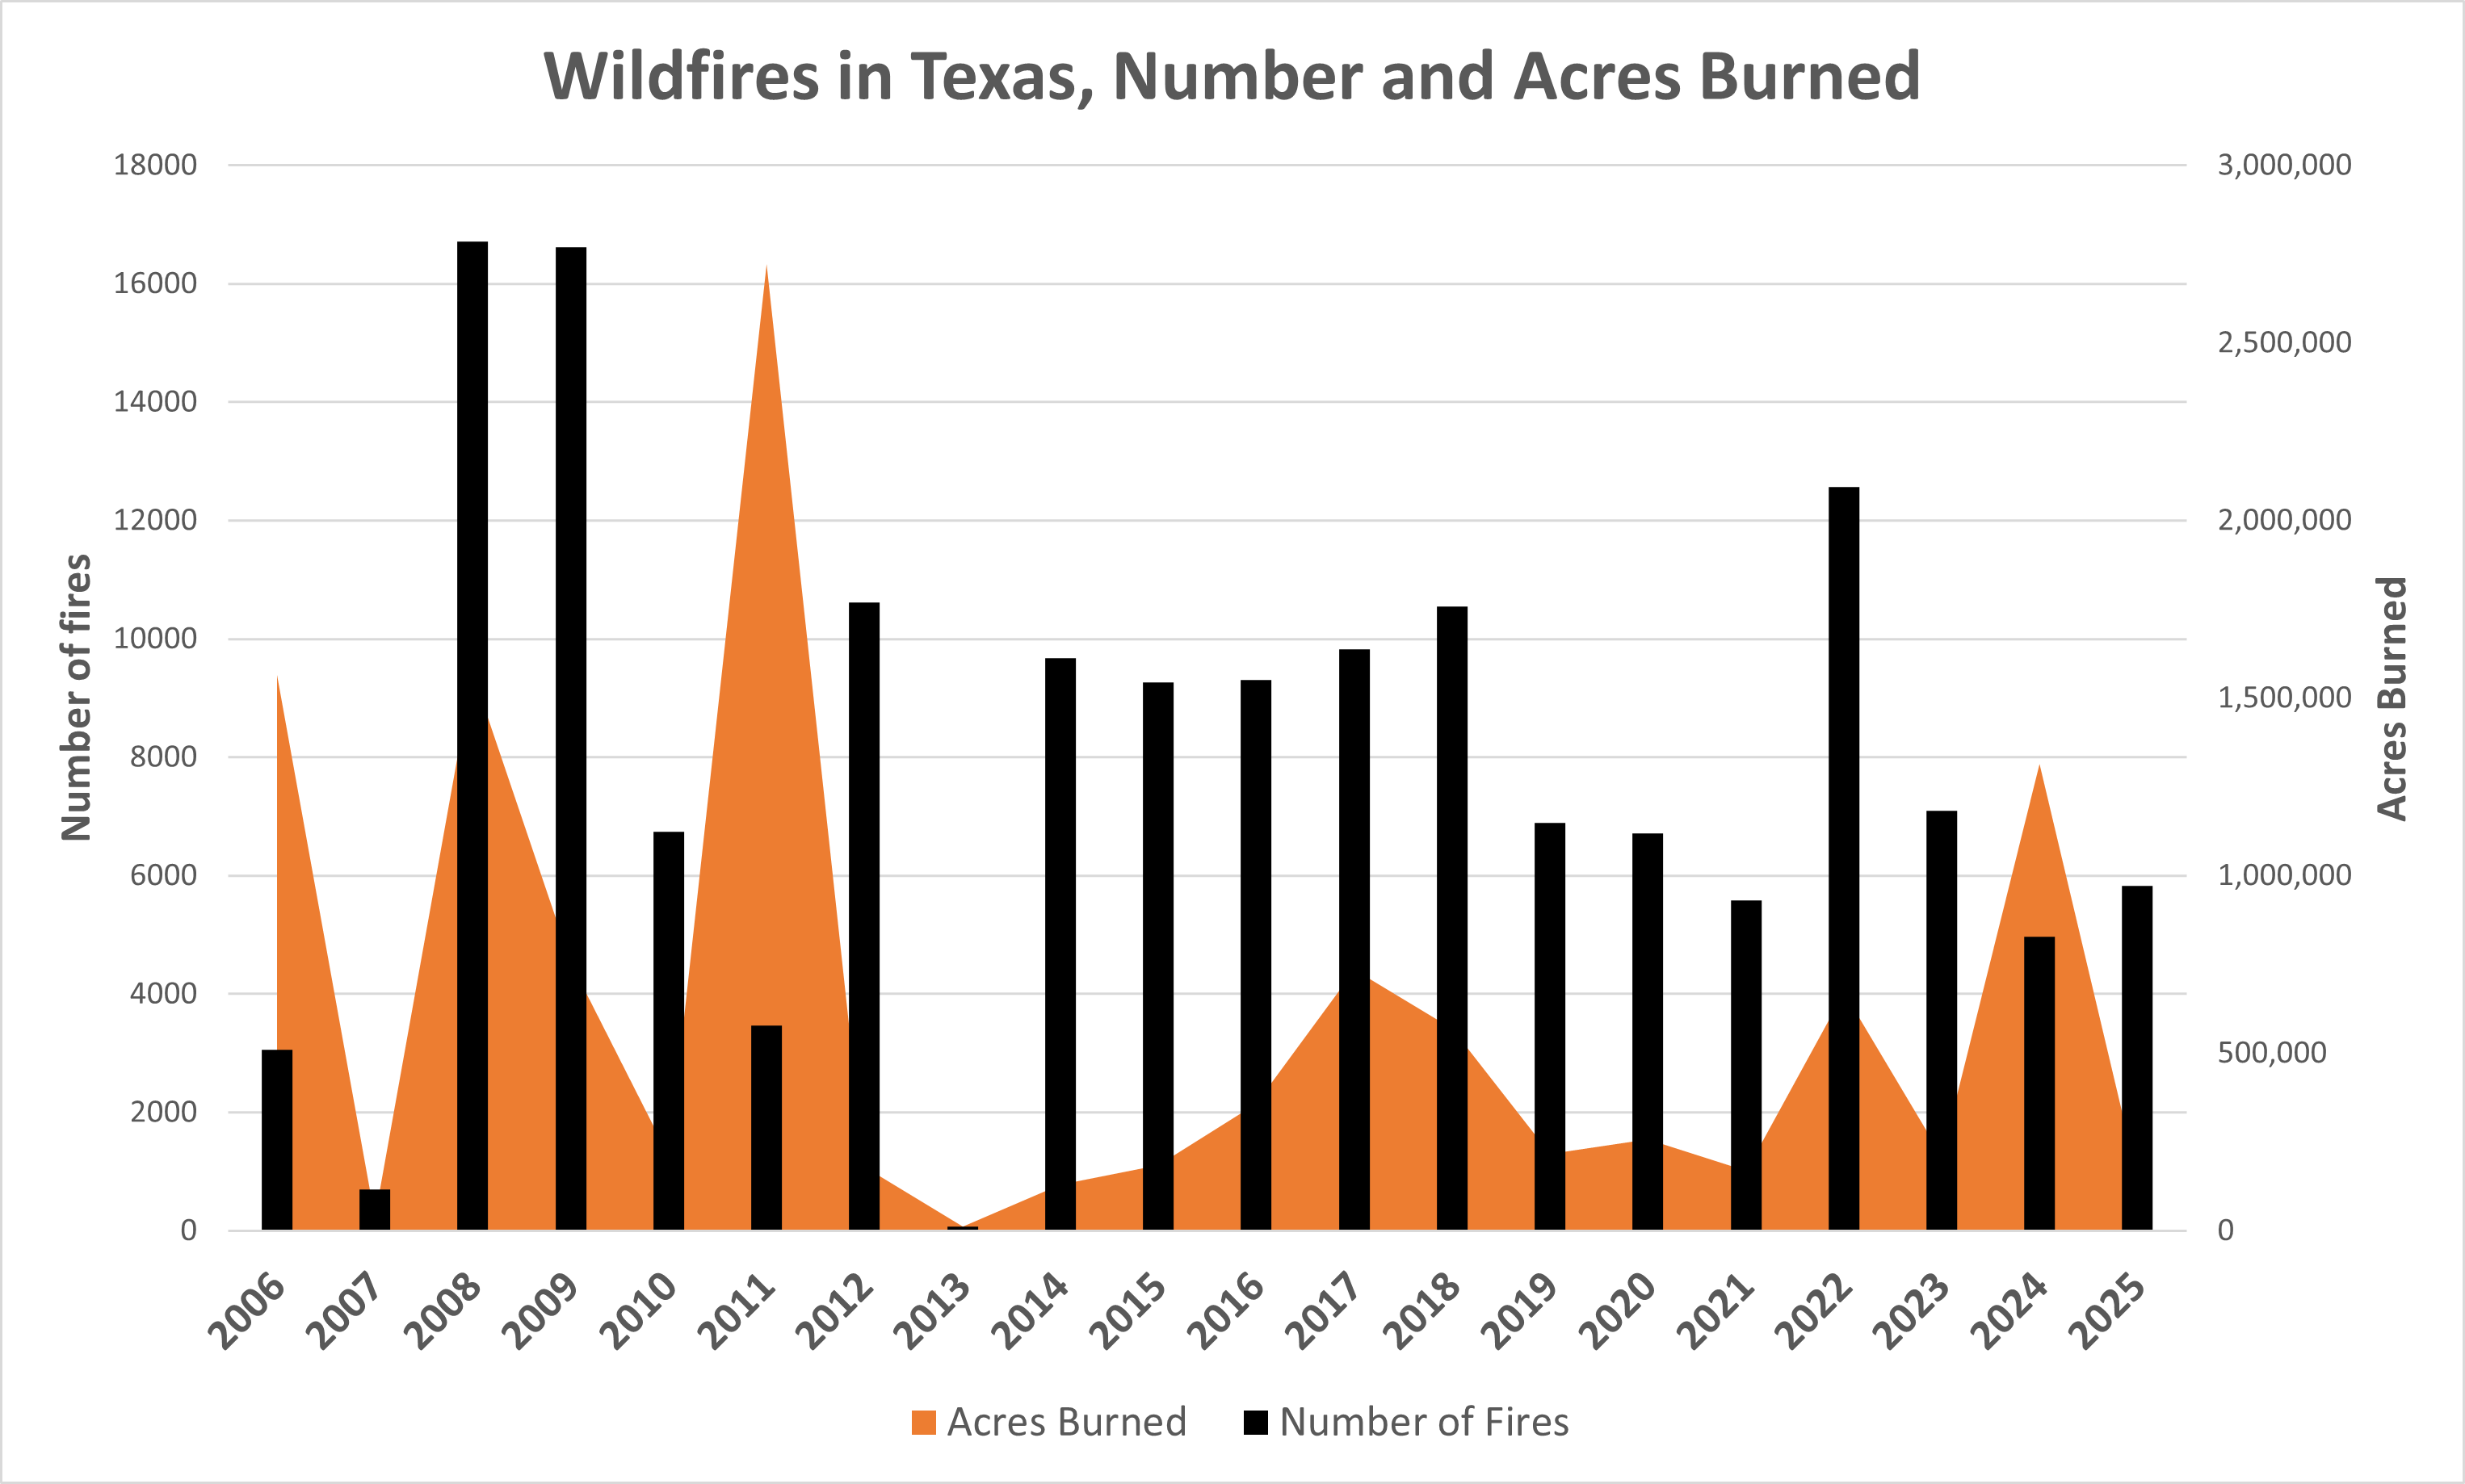
Data from the National Interagency Fire Center, available state-by-state since 2006, show there has been no increase in the number or severity of wildfires in Texas.8
Figure 2: Total Acres burned and number of wildfires in Texas since 2006. Data from National Interagency Fire Center annual reports.
Hurricanes
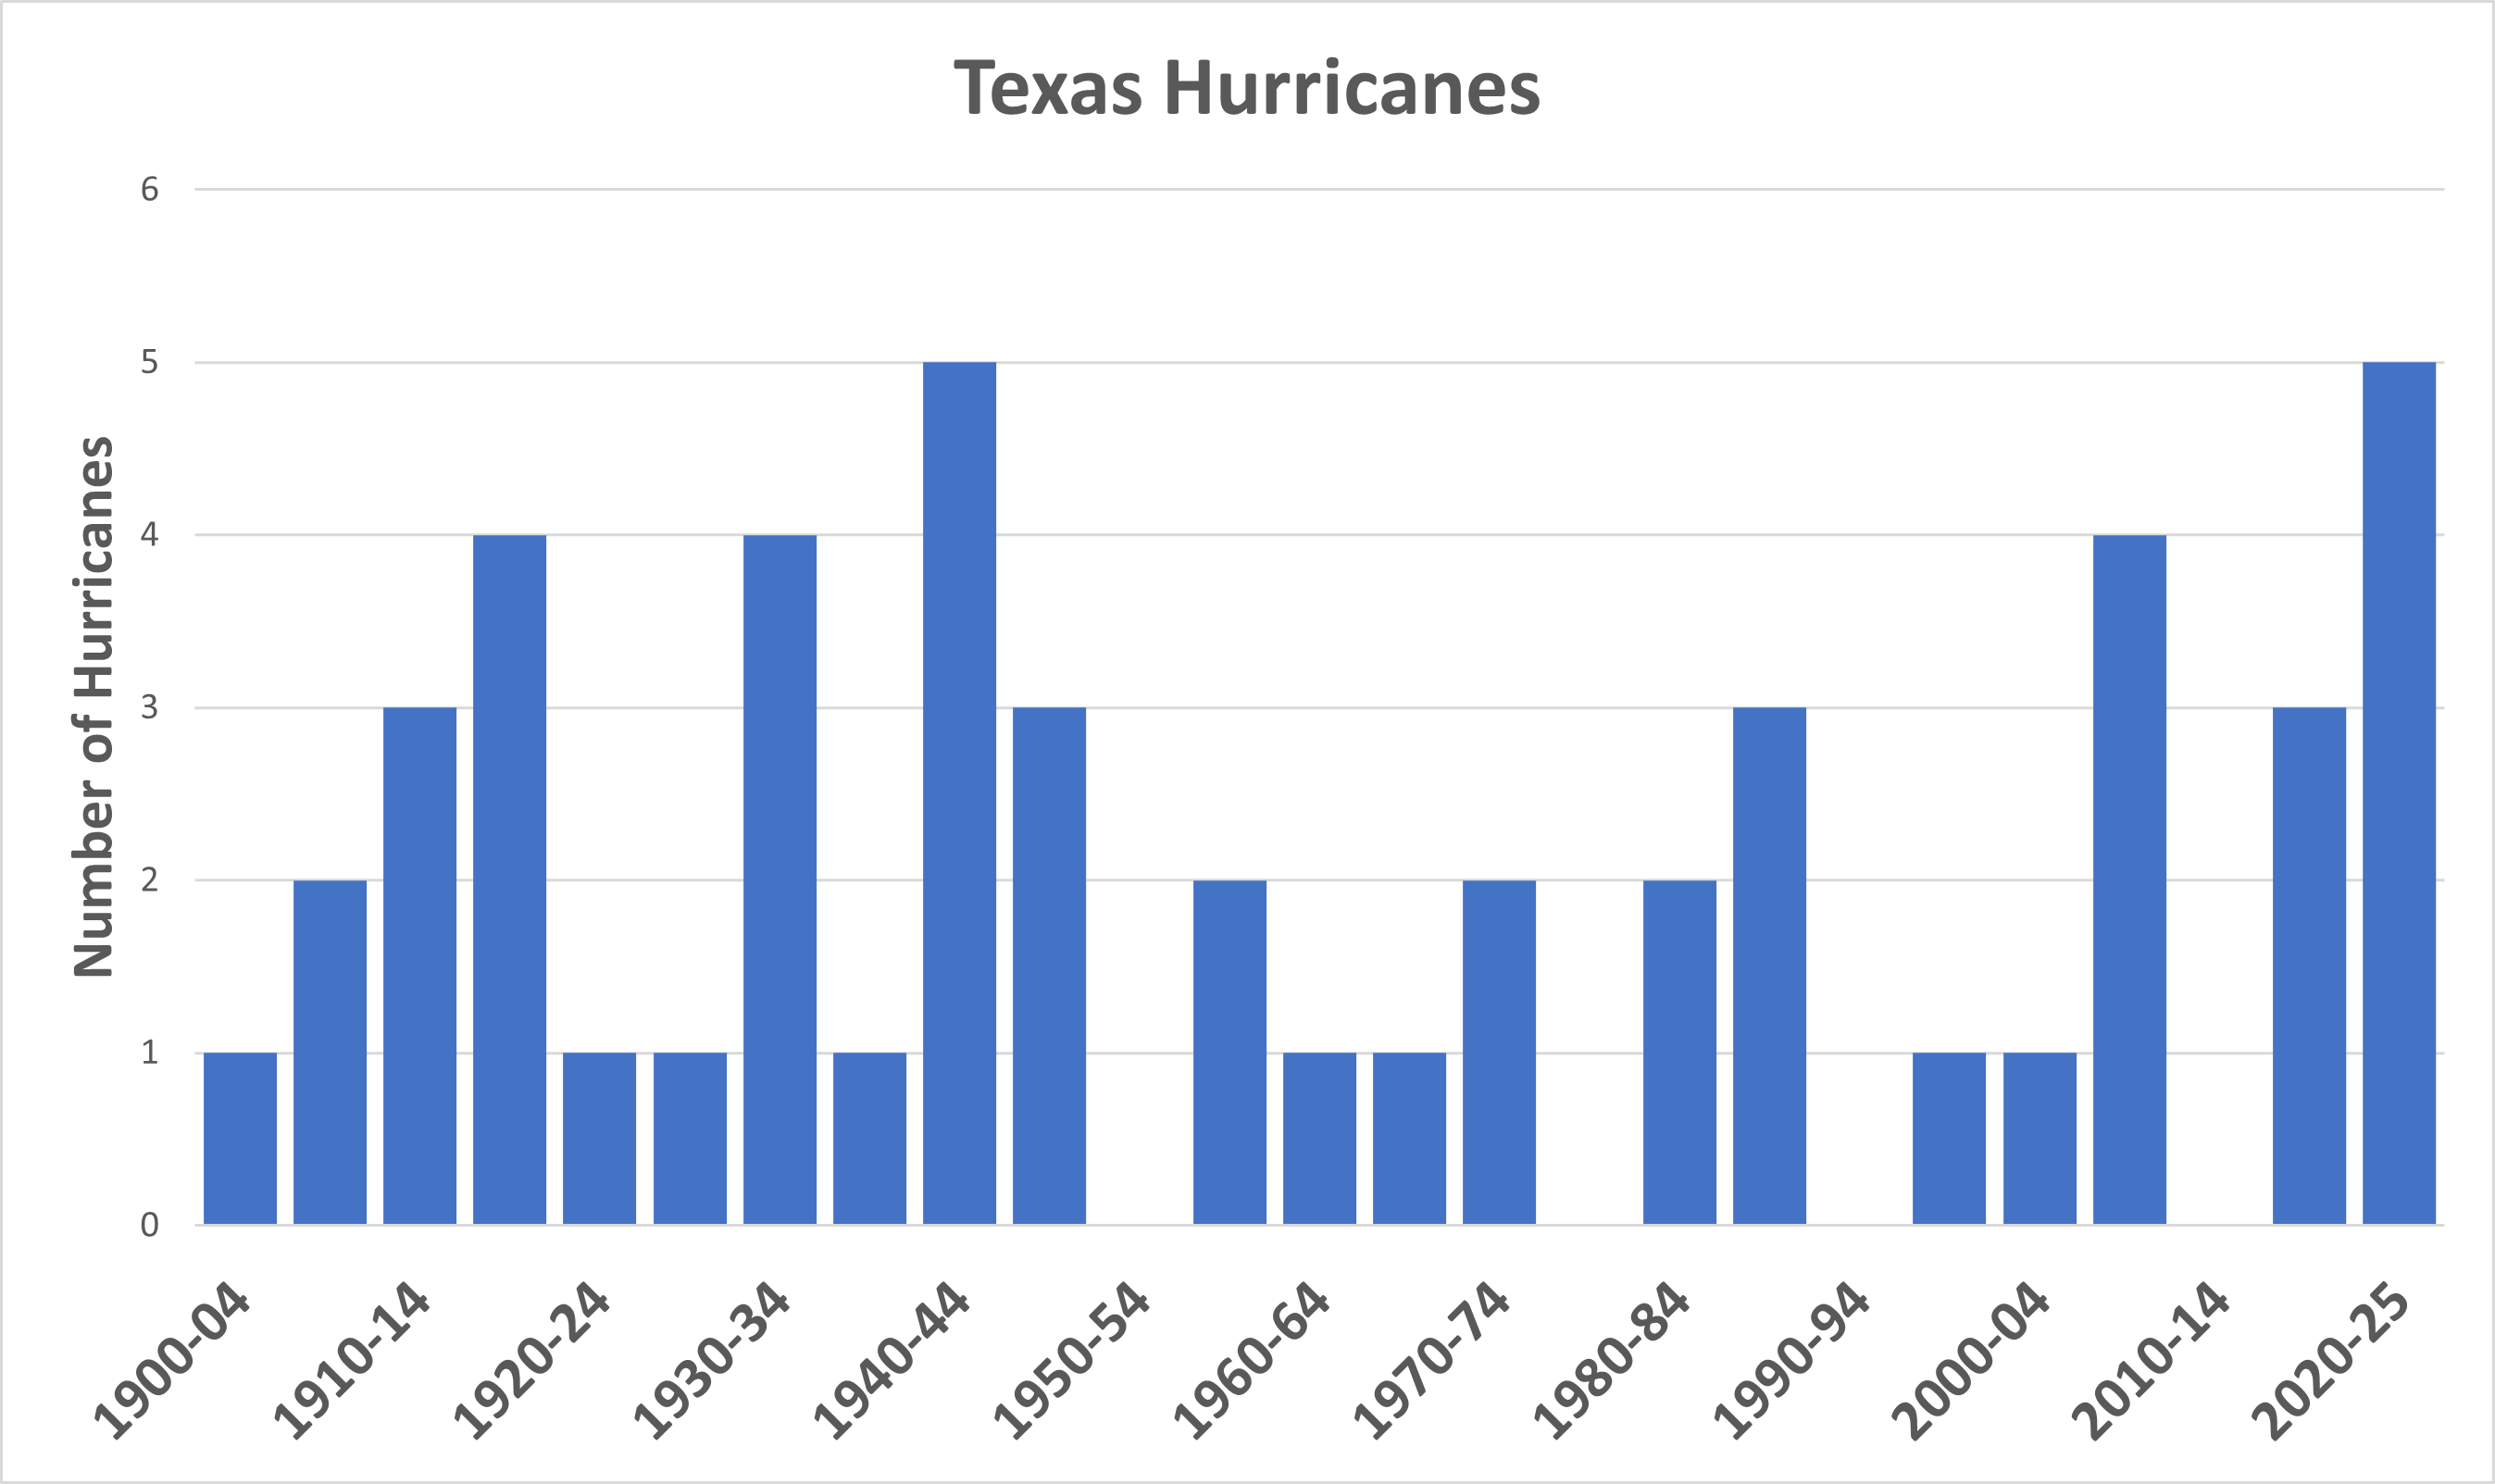
Texas has likewise not seen any trend in hurricanes since 1900.9
Figure 3: Hurricane count in 5-year intervals since 1900. Data from Runkle et al., Texas State Summaries, appended with updated hurricane data from NOAA Historical Hurricane Tracks: https://coast.noaa.gov/hurricanes/#map=4/32/-80
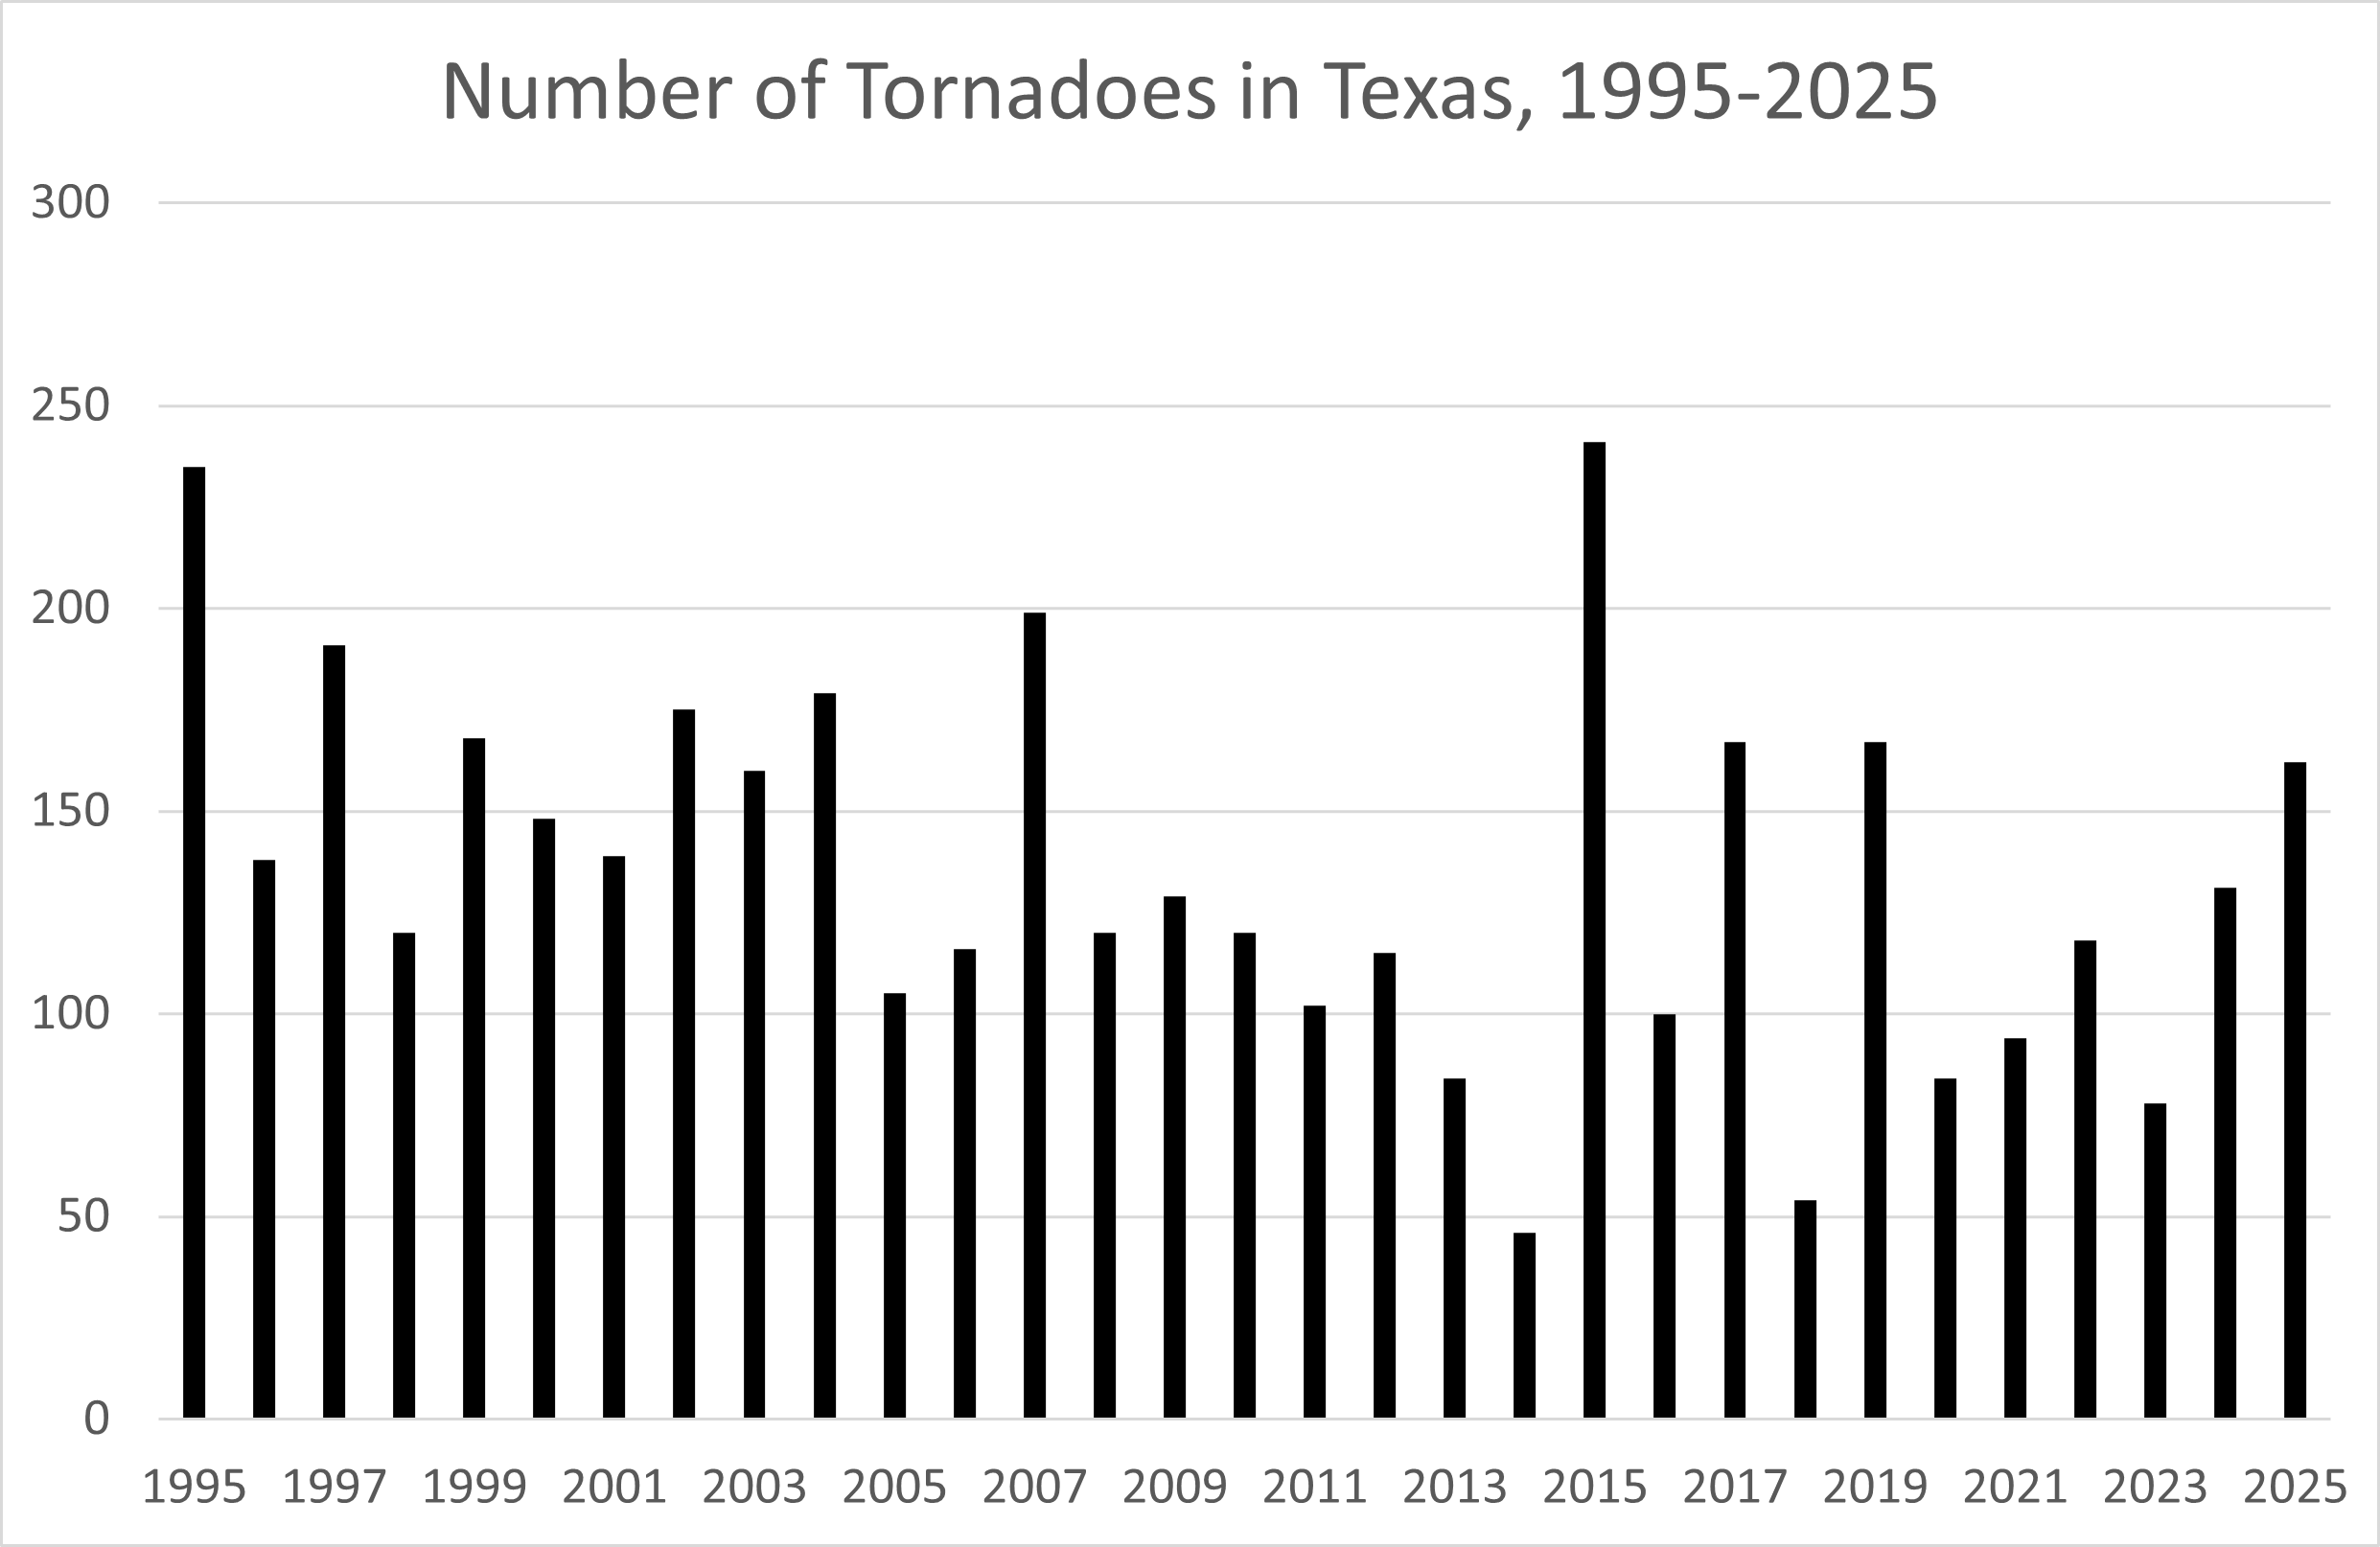
Tornadoes
The frequency of tornadoes has not increased in Texas.10
Figure 4: Annual tornado count for Texas, 1995-2025. Data from NOAA Storm Prediction Center, Severe Weather Report Database. 2025 count was preliminary at the time this report was compiled.
Agriculture:
Texas leads the country in cotton and hay/haylage production, each of which has benefitted from the modest increase in precipitation.
Cotton production has increased 46 percent since 1900,11 and yields per acre saw an even more impressive increase of 168 percent.12
Texas hay and haylage data only go back to 1994, but since then, yields have increased 10 percent.13
Corn is a major food crop in Texas, and like other crops, it has seen massive increases in both production (199 percent) and yields per acre (575 percent) since 1900.14
Conclusion
Available data on Texas weather history, as well as crop data, show no evidence that climate change is harming the Lone Star State. A slight increase in timely precipitation is aiding major crop production. There has been no increase in extremely hot days that could damage crops and other parts of the state economy, and extreme weather events are not becoming worse.
National Oceanic and Atmospheric Administration (NOAA), Storm Prediction Center, “Severe Weather Report Database (Texas),” accessed March 30, 2026, https://www.spc.noaa.gov/climo/summary/
A slight trend towards more annual precipitation is benefiting crop production.
There are no trends towards more frequent or severe wildfires, hurricanes, or tornado outbreaks.
Major crops, like cotton and hay, have experienced increased yields.
Short Summary:
Temperature Trends:
Texas, the second-largest state in the United States, is dominated largely by a humid, subtropical climate in the Eastern part of the state, and an arid, hot climate in its Western region, including some desert.1 This being the case, hot weather is the norm across all regions of Texas. However, even as the global average temperature has risen slightly, Texas has not experienced any sustained increase in the number of “extremely hot” days – defined by the National Oceanic and Atmospheric Administration as days with high temperatures reaching 100°F. Measured data show such days of extreme heat occur in Texas slightly less frequently at present than they did from the 1920s to 1950s.2
Figure 1: Observed number of very hot days since 1900. Dots are annual values. Blue bars show averages over a 5-year period, though the last bar is a 6-year average. The horizontal black line shows the average of the entire period. Chart from Jennifer Runkle and Kenneth E. Kunkel, State Climate Summaries 2022: Texas, National Centers for Environmental Information.
Average temperatures in Texas have risen nearly 1.5°F since 1900, but most of this is driven by warmer nighttime low temperatures, not daytime highs.3 These nighttime temperatures are heavily influenced by the Urban Heat Island Effect, particularly in areas that have seen substantial urban sprawl. Texas population growth has outpaced all U.S. states in recent years, and the growth of metropolitan areas like Dallas-Fort Worth, Houston, and Austin each saw more than 500,000 new residents from 2010 to 2022.4 Rising populations bring development of houses, streets, businesses, and associated infrastructure. Materials like concrete and steel, as well as vehicles, air conditioning, heating unit exhaust, and other machinery contribute to the increase in local urban and suburban nighttime temperatures.5
Precipitation:
Much of Texas is arid, but the state has seen a gradual, slight overall increase in average annual precipitation.6 Recent periods of drought are within historical norms for the past century, with the worst, long-term droughts in the modern record having occurred in the 1950s, 70 years of global warming ago.7
State-Specific Issues:
Texas is a big state in the Southwest and has a long stretch of coastline along the Gulf of America, making tornadoes, wildfires, and hurricanes more likely. The northeastern and central part of the state are also part of a large part of the continental United States commonly referred to as “Tornado Alley.”
Wildfires
Data from the National Interagency Fire Center, available state-by-state since 2006, show there has been no increase in the number or severity of wildfires in Texas.8
Figure 2: Total Acres burned and number of wildfires in Texas since 2006. Data from National Interagency Fire Center annual reports.
Hurricanes
Texas has likewise not seen any trend in hurricanes since 1900.9
Figure 3: Hurricane count in 5-year intervals since 1900. Data from Runkle et al., Texas State Summaries, appended with updated hurricane data from NOAA Historical Hurricane Tracks: https://coast.noaa.gov/hurricanes/#map=4/32/-80
Tornadoes
The frequency of tornadoes has not increased in Texas.10
Figure 4: Annual tornado count for Texas, 1995-2025. Data from NOAA Storm Prediction Center, Severe Weather Report Database. 2025 count was preliminary at the time this report was compiled.
Agriculture:
Texas leads the country in cotton and hay/haylage production, each of which has benefitted from the modest increase in precipitation.
Cotton production has increased 46 percent since 1900,11 and yields per acre saw an even more impressive increase of 168 percent.12
Texas hay and haylage data only go back to 1994, but since then, yields have increased 10 percent.13
Corn is a major food crop in Texas, and like other crops, it has seen massive increases in both production (199 percent) and yields per acre (575 percent) since 1900.14
Conclusion
Available data on Texas weather history, as well as crop data, show no evidence that climate change is harming the Lone Star State. A slight increase in timely precipitation is aiding major crop production. There has been no increase in extremely hot days that could damage crops and other parts of the state economy, and extreme weather events are not becoming worse.
National Oceanic and Atmospheric Administration (NOAA), Storm Prediction Center, “Severe Weather Report Database (Texas),” accessed March 30, 2026, https://www.spc.noaa.gov/climo/summary/
We use cookies to ensure that we give you the best experience on our website. If you continue to use this site we will assume that you are happy with it.