Due in part to the Urban Heat Island Effect in fast-growing cities, average temperatures across Arizona have increased since 1900, with a decline in “very cold” conditions likely saving lives.
Precipitation is variable in Arizona but shows no long-term negative trend. Prolonged drought is not historically unprecedented.
Rapid increases in population in arid regions have placed pressure on water resources.
Crop yields remain stable amid moderate warming.
Short Summary:
Temperature Trends:
Arizona contains several climate regions according to Köppen classification maps depending on altitude, but overall, mostly is arid with very hot summers.1
Arizona temperature stations report average temperatures have increased roughly 2.5°F since 1900, with both daytime and nighttime temperatures seeing increases.2 A large amount of the warming, particularly at night, is due to the Urban Heat Island Effect. This phenomenon has been recorded as being particularly intense in desert cities like Phoenix, where recorded urban temperatures can be 10-15° higher than nearby rural temperatures.3
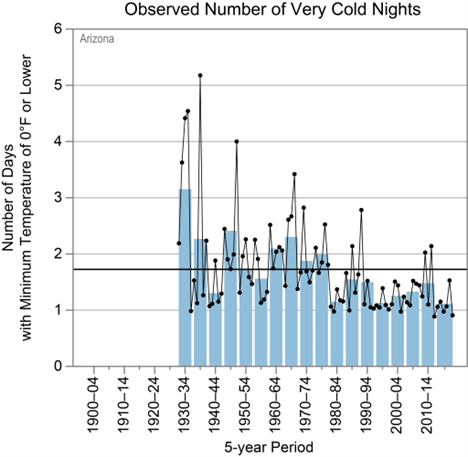
The number of “very cold” nights, or nights with minimum temperatures of 0°F or lower, have declined since the 1930s. This is one of the benefits of recent warming because very cold temperatures kill far more people than extremely hot temperatures.4
Figure 1: Observed number of very cold days since 1900. Dots are annual values. Blue bars show averages over a 5-year period, though the last bar is a 6-year average. The horizontal black line shows the average of the entire period. Chart from Rebekah Frankson and Kenneth E. Kunkel, State Climate Summaries 2022: Arizona, National Centers for Environmental Information.
Precipitation:
As a mostly desert region, Arizona is prone to extended periods of drought. Arizona is currently experiencing an extended period of drought, however, such events are not historically unprecedented.5 In fact, the state experienced droughts of similar severity in the early 1900s, 1932 to 1936, 1942 to 1964, and 1974 to 1977.6 Overall precipitation has not changed much; both annual average precipitation and hard rain events show little trend since the beginning of the twentieth century.7
State-Specific Issues:
Lake Mead
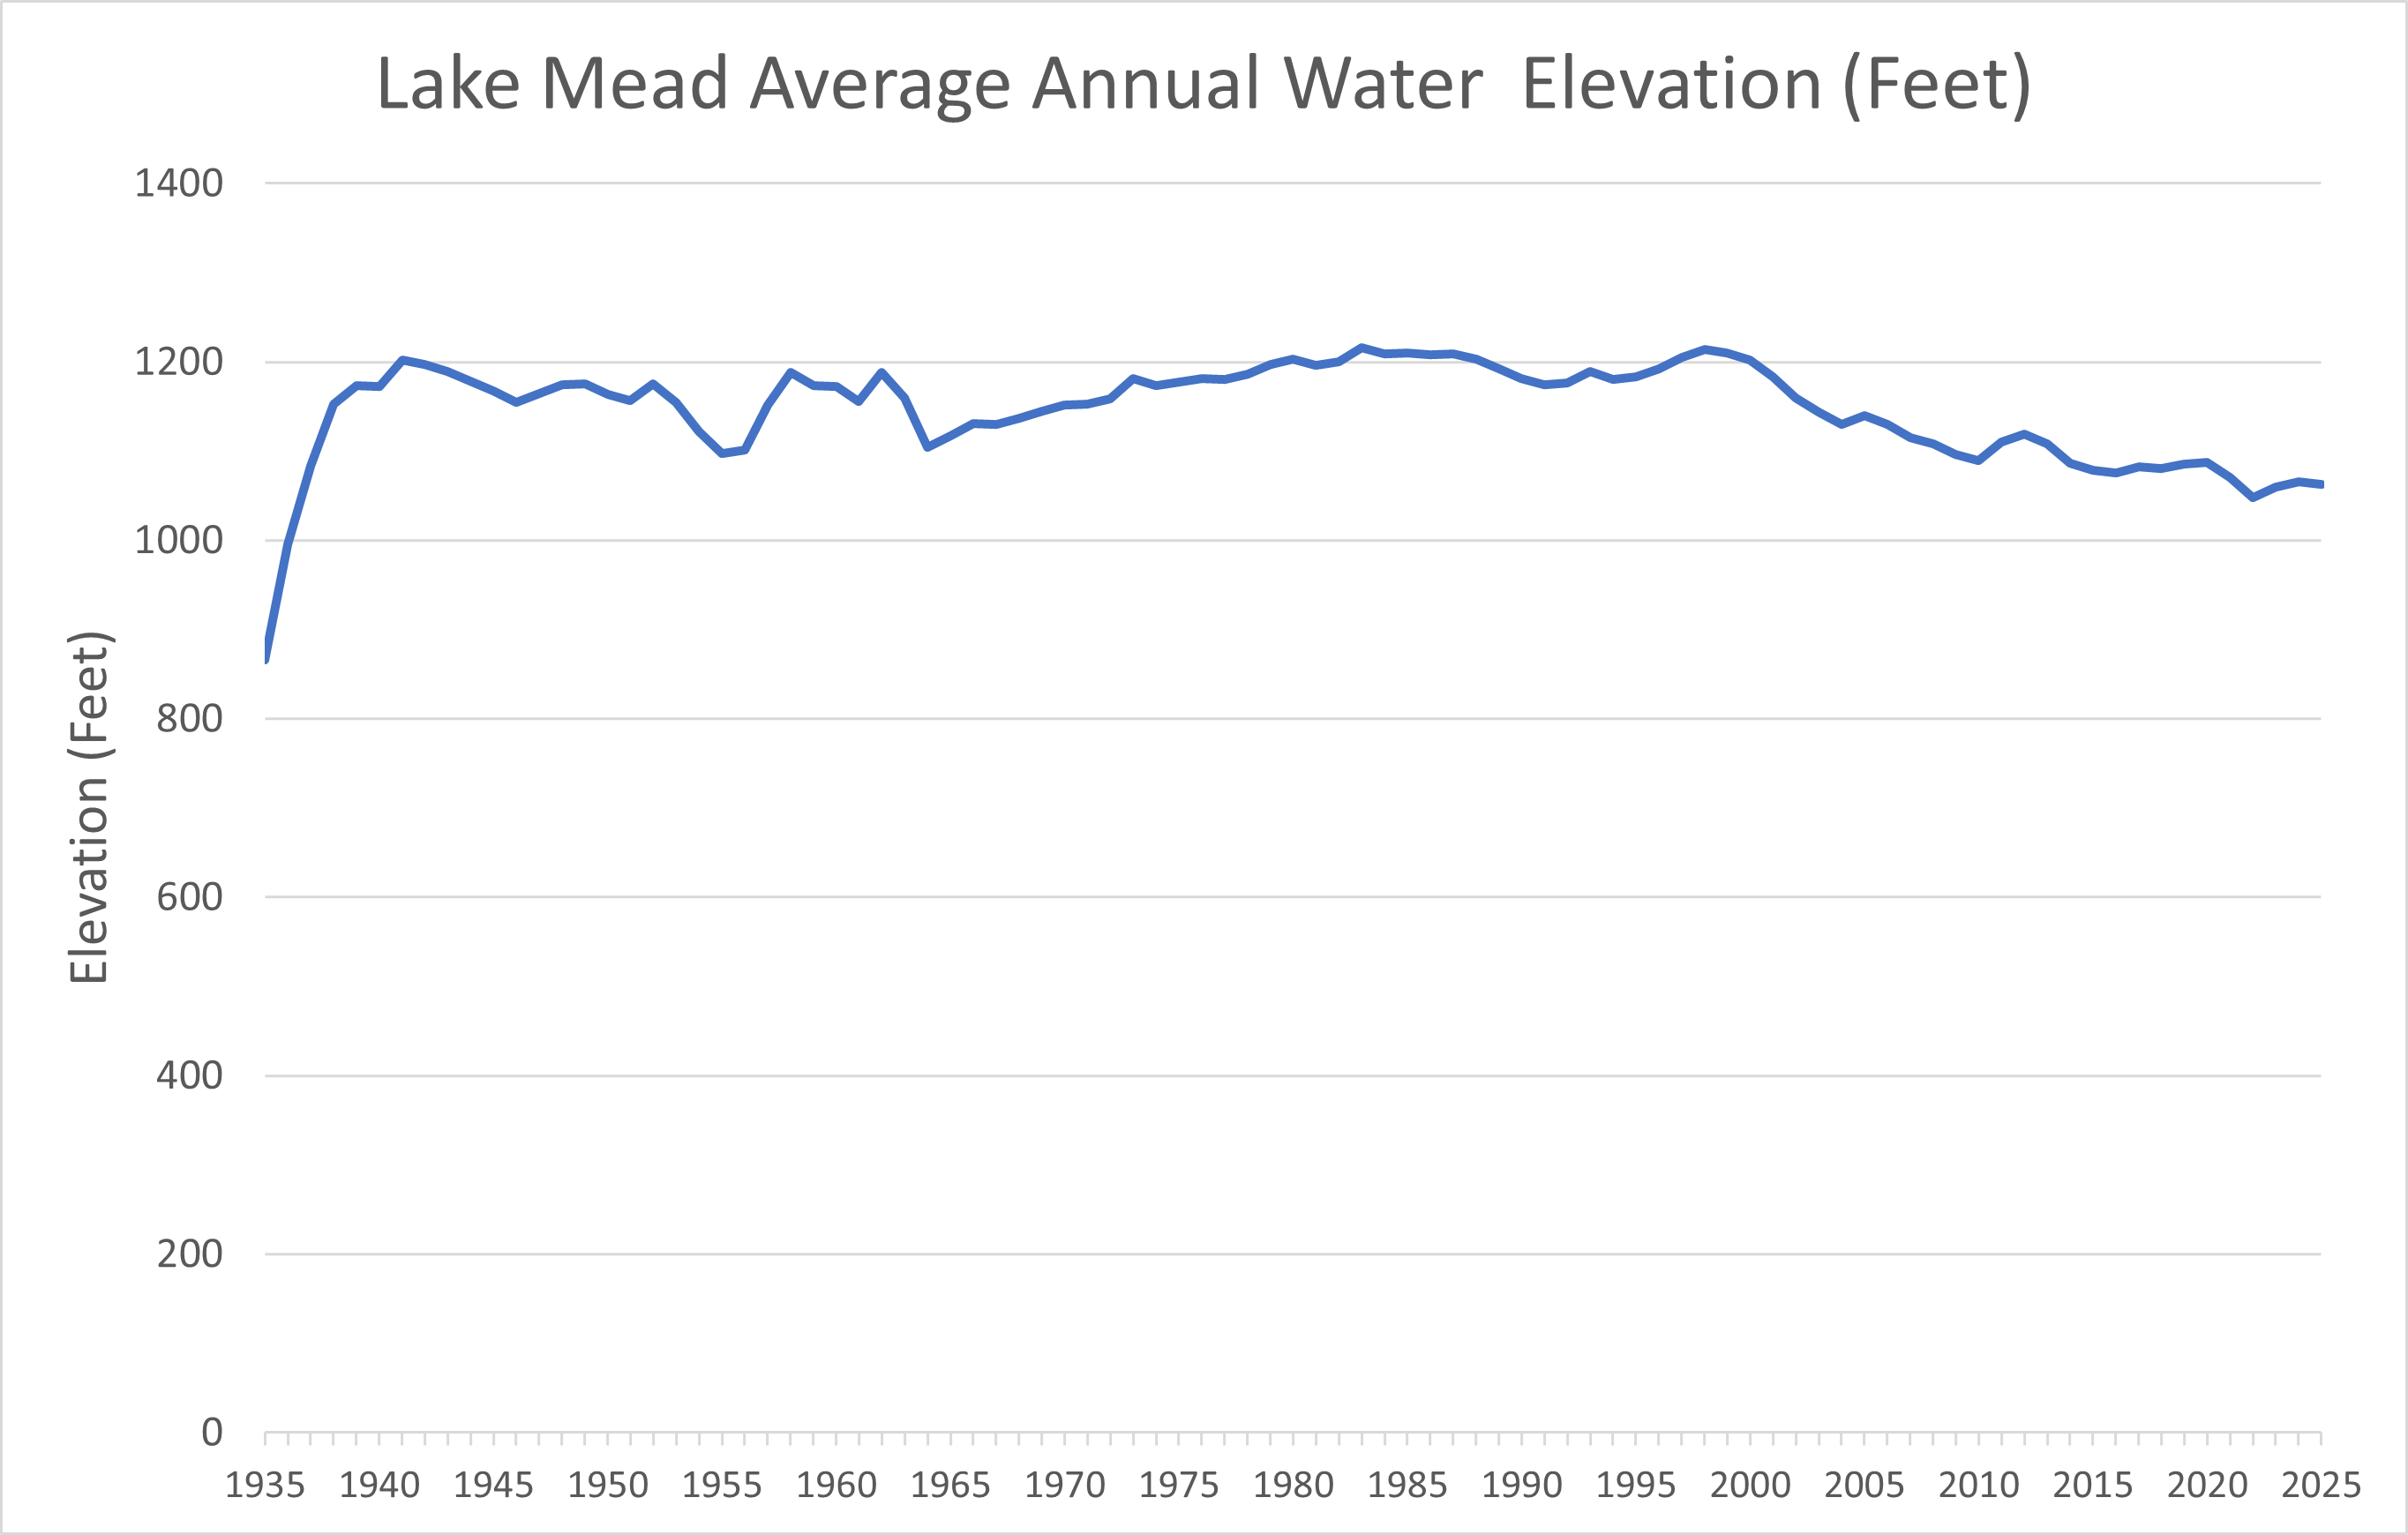
Lake Mead is an important source of water for many western states. It was formed by the construction of the Hoover Dam in 1935 on the Colorado River straddling Arizona and Nevada. It has experienced high and low water levels over time. The all-time high record was set in 1983, and remained above average until about 2002.8 Although a current drought has likely been partially responsible for the reservoir’s declining levels in recent years, the most important factor behind its decline is the rapid and large increase in the populations of the various states that draw water from Lake Mead and the Colorado River and its tributaries. Growing populations in Arizona, Colorado, Nevada, Utah, and Wyoming have resulted in large increases in demand for water for households, industries, agriculture, and businesses like golf courses.9
Figure 2: Lake Mead average annual elevation measured in feet, data from U.S. Bureau of Reclamation, Lake Mead at Hoover Dam, Elevation (Feet) – Hourly Data, accessed June 24, 2025, https://www.usbr.gov/lc/region/g4000/hourly/mead-elv.html.
Agriculture:
As an arid state, Arizona does not have as vigorous an agricultural sector as other states, however, it does have strong production of cattle, cotton, and citrus.
Some crops like alfalfa are grown to feed Arizona’s cattle population. Since 2002, yields of alfalfa have remained stable while overall production increased about 31 percent.10
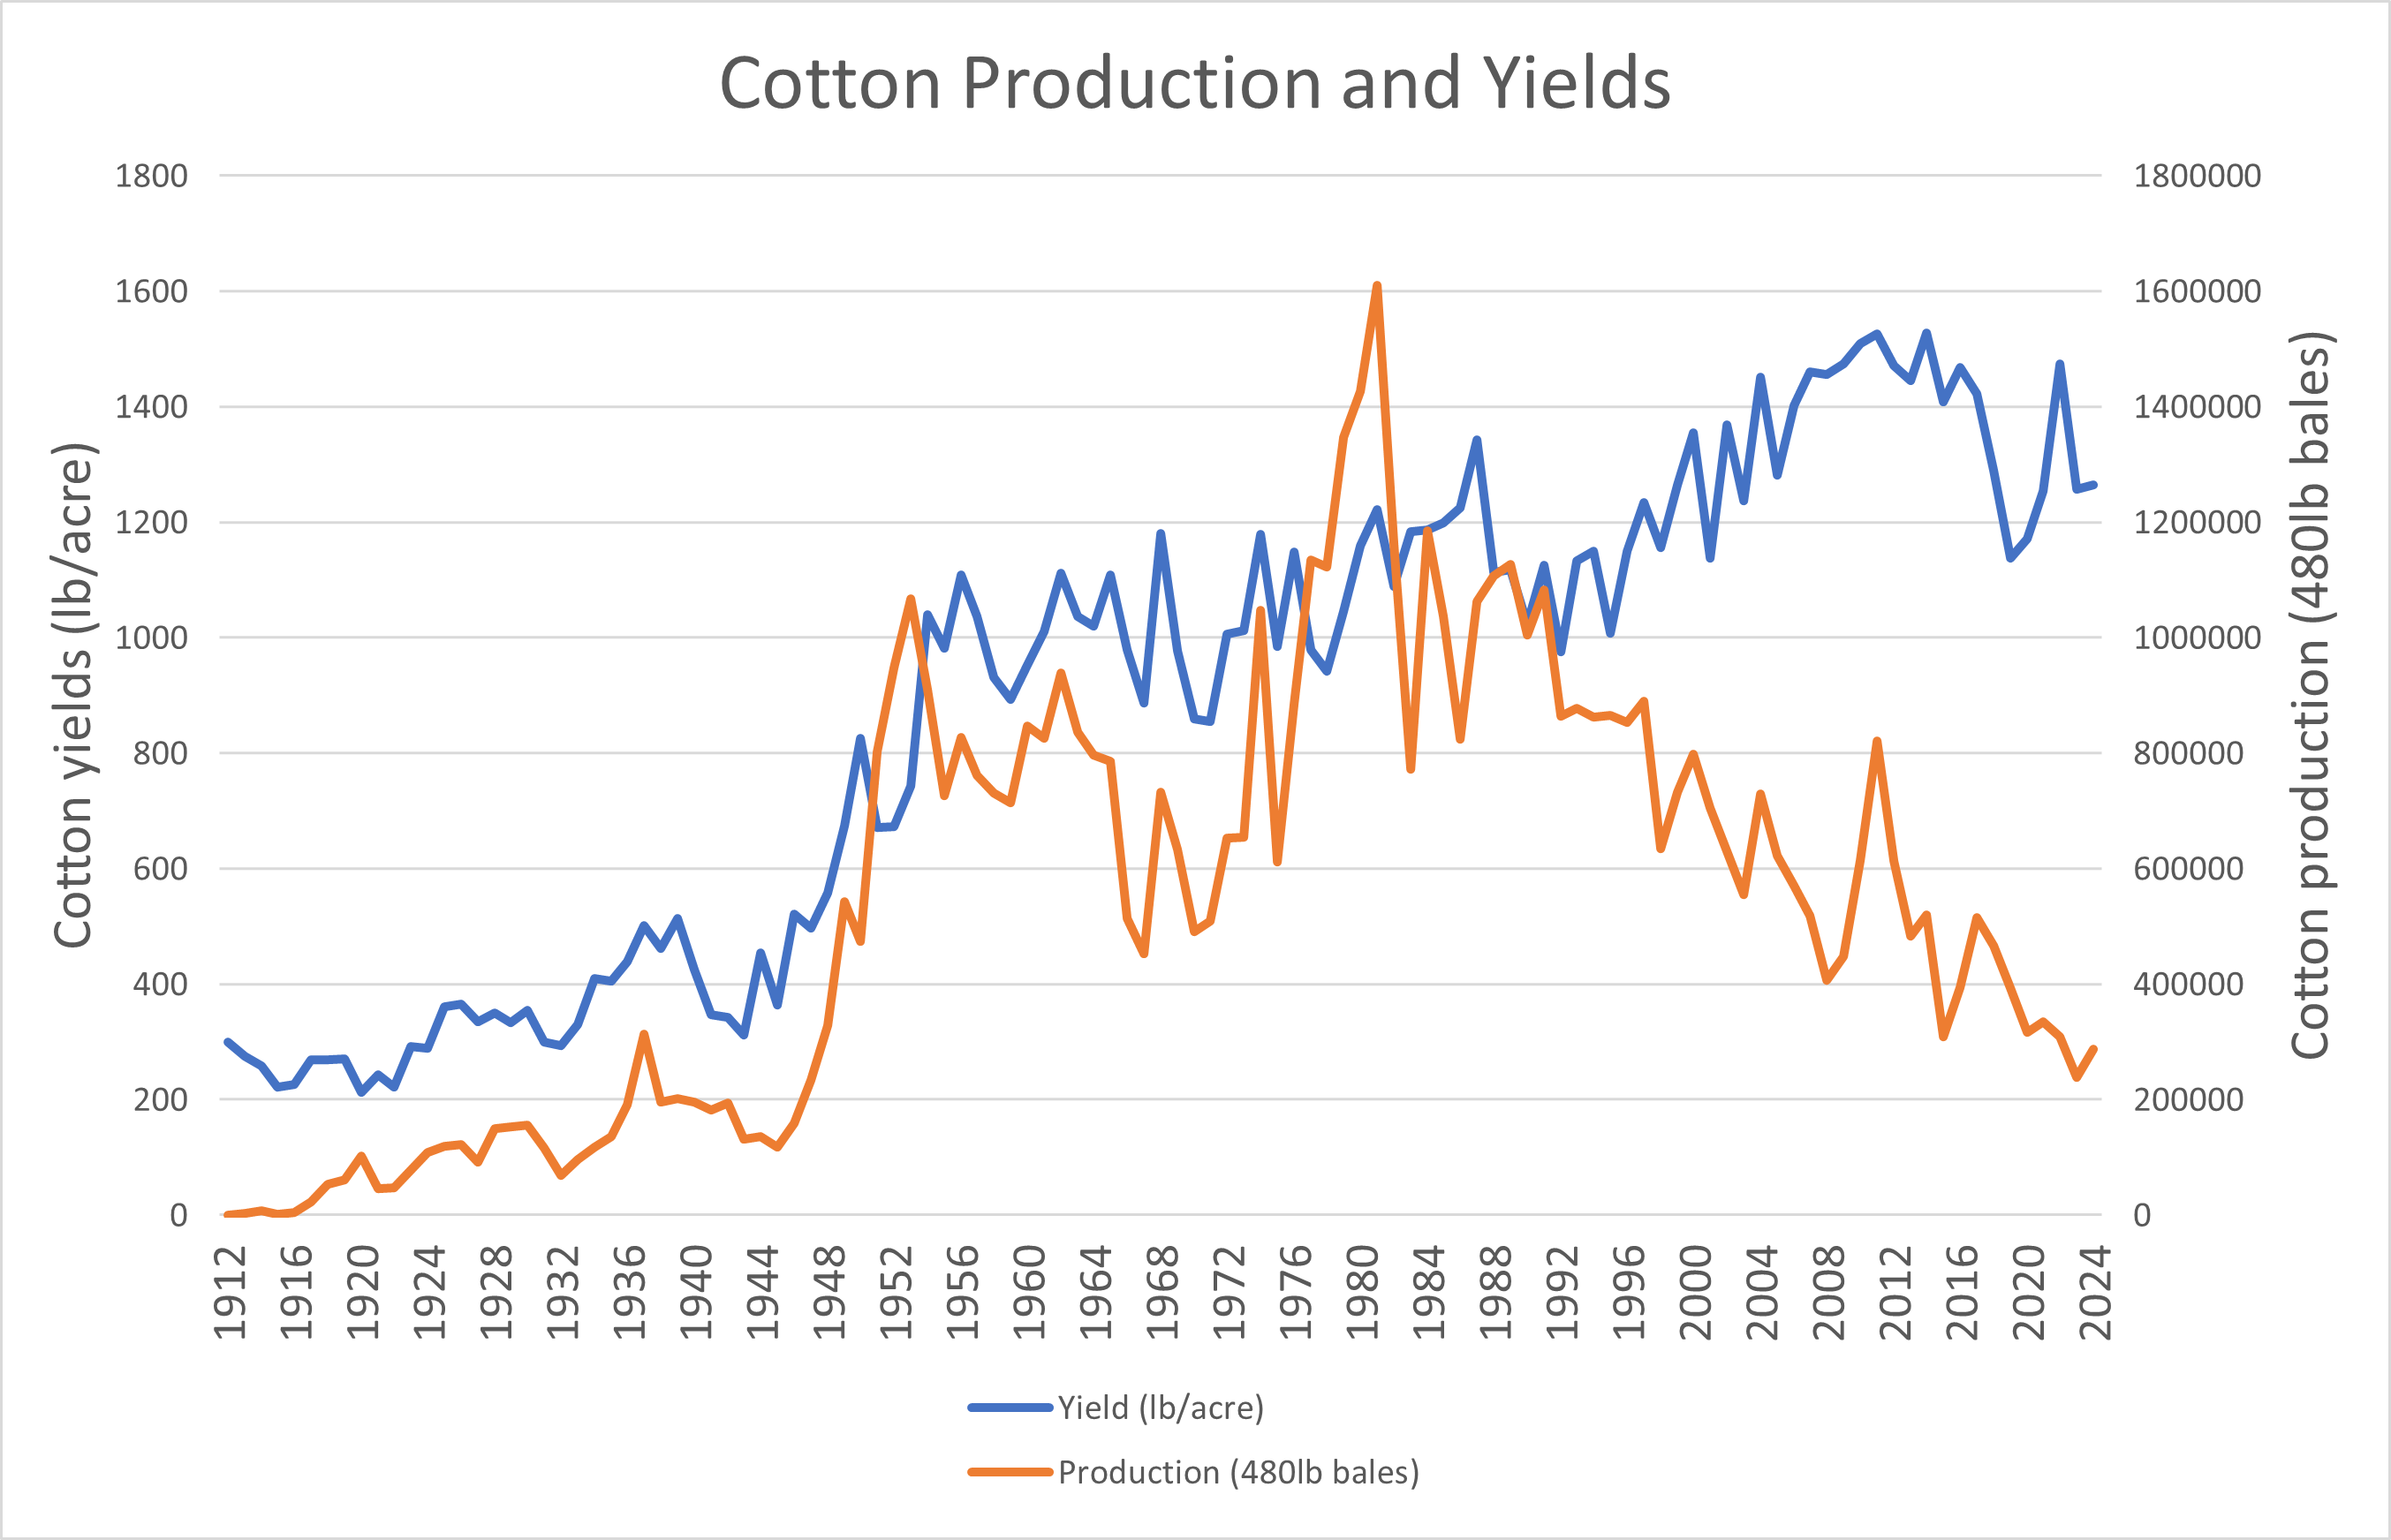
Cotton is a historically important crop for the state. Although farmers have moved away from planting as much water-hungry cotton as they produced in the 1980s and prior, cotton yields per acre have increased even as overall production declined.11
Arizona is one of the top producers of lemons. While there was a shallow dip in yields in the early 2000s, yields have since recovered. Overall lemon yields have been steady since the 1970s, except for a few seasonal variations.12
Figure 3: Cotton production and yields. Data taken from U.S. Department of Agriculture Quick Stats database surveys.
Conclusion:
As a desert state, Arizona faces challenges from water scarcity and heat, but these are not unexpected, and can be mitigated with engineering and wise resource management. Meanwhile, crop production is stable where farming and ranching take place.
References:
“United States Koppen-Geiger Climate Classification Map.” plantmaps.com, January 20, 2024. https://www.plantmaps.com/koppen-climate-classification-map-united-states.php#google_vignette
R. Frankson, K.E. Kunkel, L.E. Stevens, D.R. Easterling, T. Brown, N. Selover, and E. Saffell, Arizona State Climate Summary 2022, NOAA Technical Report NESDIS 150-AZ (Silver Spring, MD: NOAA/NESDIS, 2022), https://statesummaries.ncics.org/chapter/az/.
Arizona State University, Urban Heat Island, Global Futures Laboratory, accessed June 20, 2025, https://globalfutures.asu.edu/azclimate/urban-heat-island/.
Anthony Watts and James Taylor, ed. H. Sterling Burnett, Climate at a Glance: Temperature-Related Deaths, Heartland Institute, accessed June 10, 2025, https://climateataglance.com/climate-at-a-glance-temperature-related-deaths/.
NOAA National Centers for Environmental Information, Climate at a Glance: Statewide Time Series, published June 2025, accessed June 24, 2025, https://www.ncei.noaa.gov/access/monitoring/climate-at-a-glance/statewide/time-series.
Arizona Department of Water Resources, Arizona Drought Preparedness: Annual Report 2022, accessed June 24, 2025, https://www.azwater.gov/sites/default/files/media/2022ADPAR_0.pdf.
Frankson et al., Arizona State Climate Summary 2022.
Anthony Watts, Climate at a Glance: Water Levels – Lake Mead, https://climateataglance.com/climate-at-a-glance-water-levels-lake-mead/.
U.S. Census Bureau, Fast Growth in the Desert Southwest Continues, published February 21, 2019, https://www.census.gov/library/stories/2019/02/fast-growth-in-desert-southwest-continues.html.
U.S. Department of Agriculture, “Quick Stats: Hay, alfalfa, yield and production, Arizona” National Agricultural Statistics Service, accessed June 24, 2025, https://quickstats.nass.usda.gov/results/E0868F79-4768-35AC-872C-7DCB49D9CC72
U.S. Department of Agriculture, “Quick Stats: Cotton, yields, Arizona” National Agricultural Statistics Service, accessed June 24, 2025, https://quickstats.nass.usda.gov/results/480465AF-DEB9-33C1-B79E-009FB7E7A574
U.S. Department of Agriculture, “Quick Stats: Lemons, yield, Arizona” National Agricultural Statistics Service, accessed June 24, 2025, https://quickstats.nass.usda.gov/results/61806944-326E-3266-820D-9915C9EBEFAD
Due in part to the Urban Heat Island Effect in fast-growing cities, average temperatures across Arizona have increased since 1900, with a decline in “very cold” conditions likely saving lives.
Precipitation is variable in Arizona but shows no long-term negative trend. Prolonged drought is not historically unprecedented.
Rapid increases in population in arid regions have placed pressure on water resources.
Crop yields remain stable amid moderate warming.
Short Summary:
Temperature Trends:
Arizona contains several climate regions according to Köppen classification maps depending on altitude, but overall, mostly is arid with very hot summers.1
Arizona temperature stations report average temperatures have increased roughly 2.5°F since 1900, with both daytime and nighttime temperatures seeing increases.2 A large amount of the warming, particularly at night, is due to the Urban Heat Island Effect. This phenomenon has been recorded as being particularly intense in desert cities like Phoenix, where recorded urban temperatures can be 10-15° higher than nearby rural temperatures.3
The number of “very cold” nights, or nights with minimum temperatures of 0°F or lower, have declined since the 1930s. This is one of the benefits of recent warming because very cold temperatures kill far more people than extremely hot temperatures.4
Figure 1: Observed number of very cold days since 1900. Dots are annual values. Blue bars show averages over a 5-year period, though the last bar is a 6-year average. The horizontal black line shows the average of the entire period. Chart from Rebekah Frankson and Kenneth E. Kunkel, State Climate Summaries 2022: Arizona, National Centers for Environmental Information.
Precipitation:
As a mostly desert region, Arizona is prone to extended periods of drought. Arizona is currently experiencing an extended period of drought, however, such events are not historically unprecedented.5 In fact, the state experienced droughts of similar severity in the early 1900s, 1932 to 1936, 1942 to 1964, and 1974 to 1977.6 Overall precipitation has not changed much; both annual average precipitation and hard rain events show little trend since the beginning of the twentieth century.7
State-Specific Issues:
Lake Mead
Lake Mead is an important source of water for many western states. It was formed by the construction of the Hoover Dam in 1935 on the Colorado River straddling Arizona and Nevada. It has experienced high and low water levels over time. The all-time high record was set in 1983, and remained above average until about 2002.8 Although a current drought has likely been partially responsible for the reservoir’s declining levels in recent years, the most important factor behind its decline is the rapid and large increase in the populations of the various states that draw water from Lake Mead and the Colorado River and its tributaries. Growing populations in Arizona, Colorado, Nevada, Utah, and Wyoming have resulted in large increases in demand for water for households, industries, agriculture, and businesses like golf courses.9
Figure 2: Lake Mead average annual elevation measured in feet, data from U.S. Bureau of Reclamation, Lake Mead at Hoover Dam, Elevation (Feet) – Hourly Data, accessed June 24, 2025, https://www.usbr.gov/lc/region/g4000/hourly/mead-elv.html.
Agriculture:
As an arid state, Arizona does not have as vigorous an agricultural sector as other states, however, it does have strong production of cattle, cotton, and citrus.
Some crops like alfalfa are grown to feed Arizona’s cattle population. Since 2002, yields of alfalfa have remained stable while overall production increased about 31 percent.10
Cotton is a historically important crop for the state. Although farmers have moved away from planting as much water-hungry cotton as they produced in the 1980s and prior, cotton yields per acre have increased even as overall production declined.11
Arizona is one of the top producers of lemons. While there was a shallow dip in yields in the early 2000s, yields have since recovered. Overall lemon yields have been steady since the 1970s, except for a few seasonal variations.12
Figure 3: Cotton production and yields. Data taken from U.S. Department of Agriculture Quick Stats database surveys.
Conclusion:
As a desert state, Arizona faces challenges from water scarcity and heat, but these are not unexpected, and can be mitigated with engineering and wise resource management. Meanwhile, crop production is stable where farming and ranching take place.
References:
“United States Koppen-Geiger Climate Classification Map.” plantmaps.com, January 20, 2024. https://www.plantmaps.com/koppen-climate-classification-map-united-states.php#google_vignette
R. Frankson, K.E. Kunkel, L.E. Stevens, D.R. Easterling, T. Brown, N. Selover, and E. Saffell, Arizona State Climate Summary 2022, NOAA Technical Report NESDIS 150-AZ (Silver Spring, MD: NOAA/NESDIS, 2022), https://statesummaries.ncics.org/chapter/az/.
Arizona State University, Urban Heat Island, Global Futures Laboratory, accessed June 20, 2025, https://globalfutures.asu.edu/azclimate/urban-heat-island/.
Anthony Watts and James Taylor, ed. H. Sterling Burnett, Climate at a Glance: Temperature-Related Deaths, Heartland Institute, accessed June 10, 2025, https://climateataglance.com/climate-at-a-glance-temperature-related-deaths/.
NOAA National Centers for Environmental Information, Climate at a Glance: Statewide Time Series, published June 2025, accessed June 24, 2025, https://www.ncei.noaa.gov/access/monitoring/climate-at-a-glance/statewide/time-series.
Arizona Department of Water Resources, Arizona Drought Preparedness: Annual Report 2022, accessed June 24, 2025, https://www.azwater.gov/sites/default/files/media/2022ADPAR_0.pdf.
Frankson et al., Arizona State Climate Summary 2022.
Anthony Watts, Climate at a Glance: Water Levels – Lake Mead, https://climateataglance.com/climate-at-a-glance-water-levels-lake-mead/.
U.S. Census Bureau, Fast Growth in the Desert Southwest Continues, published February 21, 2019, https://www.census.gov/library/stories/2019/02/fast-growth-in-desert-southwest-continues.html.
U.S. Department of Agriculture, “Quick Stats: Hay, alfalfa, yield and production, Arizona” National Agricultural Statistics Service, accessed June 24, 2025, https://quickstats.nass.usda.gov/results/E0868F79-4768-35AC-872C-7DCB49D9CC72
U.S. Department of Agriculture, “Quick Stats: Cotton, yields, Arizona” National Agricultural Statistics Service, accessed June 24, 2025, https://quickstats.nass.usda.gov/results/480465AF-DEB9-33C1-B79E-009FB7E7A574
U.S. Department of Agriculture, “Quick Stats: Lemons, yield, Arizona” National Agricultural Statistics Service, accessed June 24, 2025, https://quickstats.nass.usda.gov/results/61806944-326E-3266-820D-9915C9EBEFAD
We use cookies to ensure that we give you the best experience on our website. If you continue to use this site we will assume that you are happy with it.