Image: Sea surface temperature in the eastern Pacific Ocean one year apart showing the dramatic changes in ocean temperatures brought about by a shift in ocean current patterns known as the El Niño Southern Oscillation. Source: European Space Agency.
Key Takeaways:
- Climate activists and the mainstream media often claim global ocean temperatures have dramatically increased due to climate change, citing record temperatures in 2023 to support their claims.1
- Actual data from satellites show ocean temperatures are not uniform, but widely scattered in distribution. Ocean temperatures are driven by the El Niño Southern Oscillation, which can cause a flip from cold to warm in the space of a single year.2,3
- The gradual warming of the oceans is consistent with expected mild warming coming out of the “Little Ice Age” when it ended around the year 1900.
- The 1997 and 2015 Super El Niño events caused a significant upward shift in global ocean temperature that lingers today.
Short Summary:
The temperature of the oceans is the dominant factor for Earth’s overall temperature, as they cover approximately 71 percent of the planet’s surface and have a much higher heat capacity than the atmosphere, effectively acting as a global thermostat that regulates temperature changes on Earth.4
Since 1880, the global ocean temperature has gradually increased, indicating a slow warming trend over the past century. During this period, the average ocean surface temperature has risen by roughly 0.7°C (1.26°F) compared to the late 19th century average from 1880 to 1900, as seen in Figure 1.
 Figure 1: Global Ocean Surface Temperature Anomaly, 1880-2022. Data from the National Center for Environmental Information, (NCEI). Graph by Statista.
Figure 1 illustrates that the start of gradual ocean warming is correlated with the end of the Little Ice Age (LIA), which was a period of global cooling that occurred from approximately 1400 to 1900.5 After the LIA ended, a natural rebound of ocean temperatures via slow warming was to be expected.
In addition to that gradual warming, naturally occurring El Niño events in the Pacific Ocean are known to cause ocean temperature increases. These have been anecdotally recorded as far back as 2,000 years.6 For example, the 1997/1998 Super El Niño event caused temperatures to elevate worldwide.7 During the 1997/1998 Super El Niño event, ocean temperatures in the equatorial Pacific rose by an average of 2-4°C (3.6-7.2°F) above normal, with some areas experiencing increases exceeding 2.5°C (4.5°F) compared to the long-term average. This warming significantly impacted global temperatures due to the redistribution of heat through atmospheric circulation.8
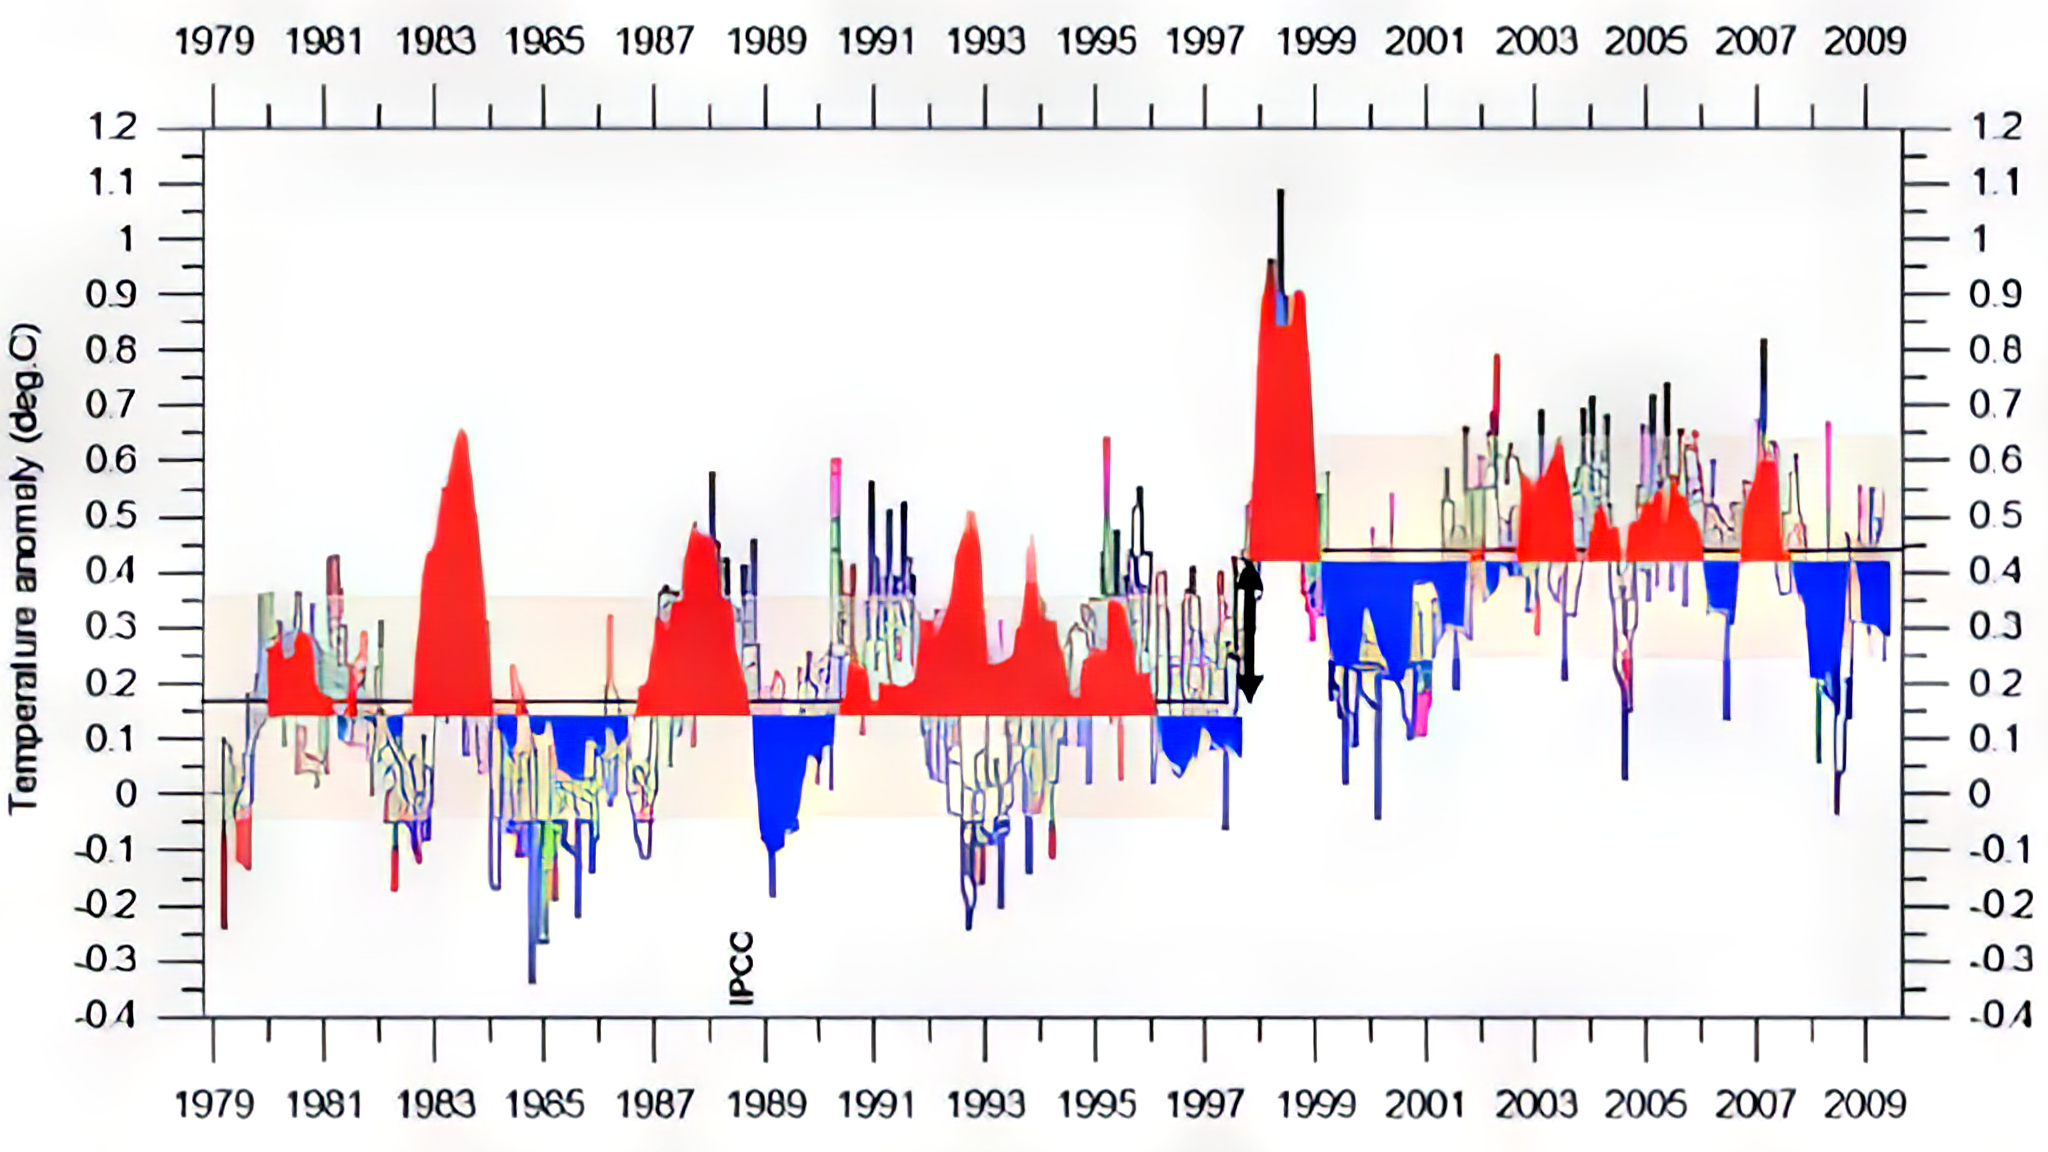
Figure 2 shows how the 1997/1998 Super El Niño event caused a steep elevation in ocean and air temperatures that remains today, because not all the heat created from that event has yet to be fully dissipated from the planet.
Figure 2: Comparison of ENSO events (red is El Niño blue is La Niña) with global ocean and air temperatures from several sources. Note the steep change to a new baseline temperature in 1997/1998 from the Super El Niño event. Graphic by Robert Tisdale.
A second Super El Niño event that occurred in 2015 added additional heat to the oceans and atmosphere. According to NOAA data, the 2015 El Niño event saw sea surface temperature reach over 2°C (3.6°F) above average, ranking it among the strongest on record.9 It contributed significantly to the overall heat content of the tropical Pacific Ocean. This contributed to 2015 being recorded as the warmest year on record at the time due to the substantial heat added by the El Niño event.
In 2023, global temperatures reached new peak levels, which contributed to one of the hottest years on record. A scientific analysis showed that once again, an El Niño event was the driver. The results indicate that the 2023 warming spike was primarily caused from the El Niño–Southern Oscillation, rather than human-induced global warming events.10
To sum up, contrary to commonly made claims that human caused climate change is warming the oceans, the warming over the last century can be attributed to natural events, such as rebound from the LIA and two Super El Niño events adding heat to the oceans that is slowly dissipating. Moreover, because oceans constitute more than 70 percent of the Earth’s surface, naturally warming oceans contribute to rising estimated global average temperatures.
References:
- Copernicus Climate Change Service, Global air and ocean temperatures reach new record highs, accessed 10/2/24, https://climate.copernicus.eu/july-2023-global-air-and-ocean-temperatures-reach-new-record-highs
- National Oceanic and Atmospheric Administration, What is the El Niño–Southern Oscillation (ENSO) in a nutshell?, 10/5/2014, accessed 10/2/2024, https://www.climate.gov/news-features/blogs/enso/what-el-ni%C3%B1o%E2%80%93southern-oscillation-enso-nutshell
- The European Space Agency, Sea-surface temperatures May 2022 and May 2023, 5/17/2023, accessed 10/2/2024, https://www.esa.int/ESA_Multimedia/Images/2023/05/Sea-surface_temperatures_May_2022_and_May_2023
- NASA Science, Temperature trackers watch waxings and wanings of our watery world, Feb 23, 2010, accessed 10/6/24, https://science.nasa.gov/earth/water-on-earth/temperature-trackers-watch-waxings-and-wanings-of-our-watery-world/
- Jackson, Stephen T. and Rafferty, John P. “Little Ice Age”. Encyclopedia Britannica, 4 Jul. 2024, https://www.britannica.com/science/Little-Ice-Age Accessed 9 October 2024.
- National Oceanic and Atmospheric Administration, The Human History of El Niño, 02/17/2017, accessed 10/8/24, https://earthobservatory.nasa.gov/features/ElNino/page3.php
- National Oceanic and Atmospheric Administration, The 1997-98 El Niño, Revised March 19, 2024, accessed, 10/7/24, https://celebrating200years.noaa.gov/magazine/enso/el_nino.html
- Michael J. McPhaden, Genesis and Evolution of the 1997-98 El Niño, Pacific Marine Environmental Laboratory, National Oceanic and Atmospheric Administration, Science, 283, 950–954 (1999), accessed, 10/8/24, https://www.pmel.noaa.gov/pubs/outstand/mcph2029/text.shtml
- National Oceanic and Atmospheric Administration, 2015 State of the Climate: El Niño came, saw, and conquered, 8/2/2016, accessed 10/9/2024, https://www.climate.gov/news-features/understanding-climate/2015-state-climate-el-ni%C3%B1o-came-saw-and-conquered
- University of Miami, Rosenstiel School, El Niño Southern Oscillation caused spike in 2023 temperatures, new study found, published 10/14/23, accessed 10/16/24, https://news.miami.edu/rosenstiel/stories/2024/10/el-nino-southern-oscillation-caused-the-spike-in-2023-temperatures-new-study-found.html
Image: Sea surface temperature in the eastern Pacific Ocean one year apart showing the dramatic changes in ocean temperatures brought about by a shift in ocean current patterns known as the El Niño Southern Oscillation. Source: European Space Agency.
Key Takeaways:
- Climate activists and the mainstream media often claim global ocean temperatures have dramatically increased due to climate change, citing record temperatures in 2023 to support their claims.1
- Actual data from satellites show ocean temperatures are not uniform, but widely scattered in distribution. Ocean temperatures are driven by the El Niño Southern Oscillation, which can cause a flip from cold to warm in the space of a single year.2,3
- The gradual warming of the oceans is consistent with expected mild warming coming out of the “Little Ice Age” when it ended around the year 1900.
- The 1997 and 2015 Super El Niño events caused a significant upward shift in global ocean temperature that lingers today.
Short Summary:
The temperature of the oceans is the dominant factor for Earth’s overall temperature, as they cover approximately 71 percent of the planet’s surface and have a much higher heat capacity than the atmosphere, effectively acting as a global thermostat that regulates temperature changes on Earth.4
Since 1880, the global ocean temperature has gradually increased, indicating a slow warming trend over the past century. During this period, the average ocean surface temperature has risen by roughly 0.7°C (1.26°F) compared to the late 19th century average from 1880 to 1900, as seen in Figure 1.
Figure 1: Global Ocean Surface Temperature Anomaly, 1880-2022. Data from the National Center for Environmental Information, (NCEI). Graph by Statista.
Figure 1 illustrates that the start of gradual ocean warming is correlated with the end of the Little Ice Age (LIA), which was a period of global cooling that occurred from approximately 1400 to 1900.5 After the LIA ended, a natural rebound of ocean temperatures via slow warming was to be expected.
In addition to that gradual warming, naturally occurring El Niño events in the Pacific Ocean are known to cause ocean temperature increases. These have been anecdotally recorded as far back as 2,000 years.6 For example, the 1997/1998 Super El Niño event caused temperatures to elevate worldwide.7 During the 1997/1998 Super El Niño event, ocean temperatures in the equatorial Pacific rose by an average of 2-4°C (3.6-7.2°F) above normal, with some areas experiencing increases exceeding 2.5°C (4.5°F) compared to the long-term average. This warming significantly impacted global temperatures due to the redistribution of heat through atmospheric circulation.8
Figure 2 shows how the 1997/1998 Super El Niño event caused a steep elevation in ocean and air temperatures that remains today, because not all the heat created from that event has yet to be fully dissipated from the planet.
Figure 2: Comparison of ENSO events (red is El Niño blue is La Niña) with global ocean and air temperatures from several sources. Note the steep change to a new baseline temperature in 1997/1998 from the Super El Niño event. Graphic by Robert Tisdale.
A second Super El Niño event that occurred in 2015 added additional heat to the oceans and atmosphere. According to NOAA data, the 2015 El Niño event saw sea surface temperature reach over 2°C (3.6°F) above average, ranking it among the strongest on record.9 It contributed significantly to the overall heat content of the tropical Pacific Ocean. This contributed to 2015 being recorded as the warmest year on record at the time due to the substantial heat added by the El Niño event.
In 2023, global temperatures reached new peak levels, which contributed to one of the hottest years on record. A scientific analysis showed that once again, an El Niño event was the driver. The results indicate that the 2023 warming spike was primarily caused from the El Niño–Southern Oscillation, rather than human-induced global warming events.10
To sum up, contrary to commonly made claims that human caused climate change is warming the oceans, the warming over the last century can be attributed to natural events, such as rebound from the LIA and two Super El Niño events adding heat to the oceans that is slowly dissipating. Moreover, because oceans constitute more than 70 percent of the Earth’s surface, naturally warming oceans contribute to rising estimated global average temperatures.
References:
- Copernicus Climate Change Service, Global air and ocean temperatures reach new record highs, accessed 10/2/24, https://climate.copernicus.eu/july-2023-global-air-and-ocean-temperatures-reach-new-record-highs
- National Oceanic and Atmospheric Administration, What is the El Niño–Southern Oscillation (ENSO) in a nutshell?, 10/5/2014, accessed 10/2/2024, https://www.climate.gov/news-features/blogs/enso/what-el-ni%C3%B1o%E2%80%93southern-oscillation-enso-nutshell
- The European Space Agency, Sea-surface temperatures May 2022 and May 2023, 5/17/2023, accessed 10/2/2024, https://www.esa.int/ESA_Multimedia/Images/2023/05/Sea-surface_temperatures_May_2022_and_May_2023
- NASA Science, Temperature trackers watch waxings and wanings of our watery world, Feb 23, 2010, accessed 10/6/24, https://science.nasa.gov/earth/water-on-earth/temperature-trackers-watch-waxings-and-wanings-of-our-watery-world/
- Jackson, Stephen T. and Rafferty, John P. “Little Ice Age”. Encyclopedia Britannica, 4 Jul. 2024, https://www.britannica.com/science/Little-Ice-Age Accessed 9 October 2024.
- National Oceanic and Atmospheric Administration, The Human History of El Niño, 02/17/2017, accessed 10/8/24, https://earthobservatory.nasa.gov/features/ElNino/page3.php
- National Oceanic and Atmospheric Administration, The 1997-98 El Niño, Revised March 19, 2024, accessed, 10/7/24, https://celebrating200years.noaa.gov/magazine/enso/el_nino.html
- Michael J. McPhaden, Genesis and Evolution of the 1997-98 El Niño, Pacific Marine Environmental Laboratory, National Oceanic and Atmospheric Administration, Science, 283, 950–954 (1999), accessed, 10/8/24, https://www.pmel.noaa.gov/pubs/outstand/mcph2029/text.shtml
- National Oceanic and Atmospheric Administration, 2015 State of the Climate: El Niño came, saw, and conquered, 8/2/2016, accessed 10/9/2024, https://www.climate.gov/news-features/understanding-climate/2015-state-climate-el-ni%C3%B1o-came-saw-and-conquered
- University of Miami, Rosenstiel School, El Niño Southern Oscillation caused spike in 2023 temperatures, new study found, published 10/14/23, accessed 10/16/24, https://news.miami.edu/rosenstiel/stories/2024/10/el-nino-southern-oscillation-caused-the-spike-in-2023-temperatures-new-study-found.html

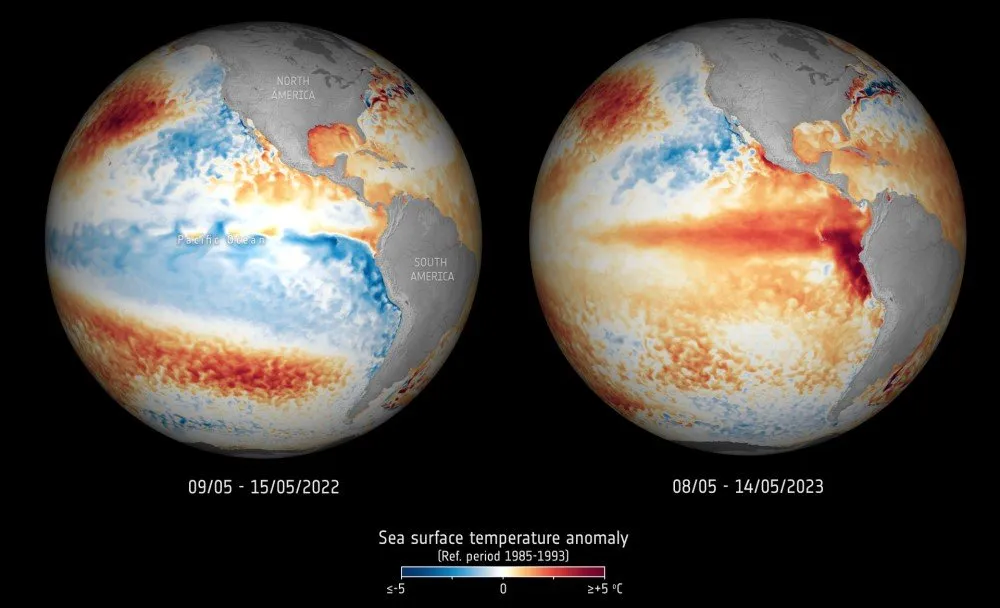
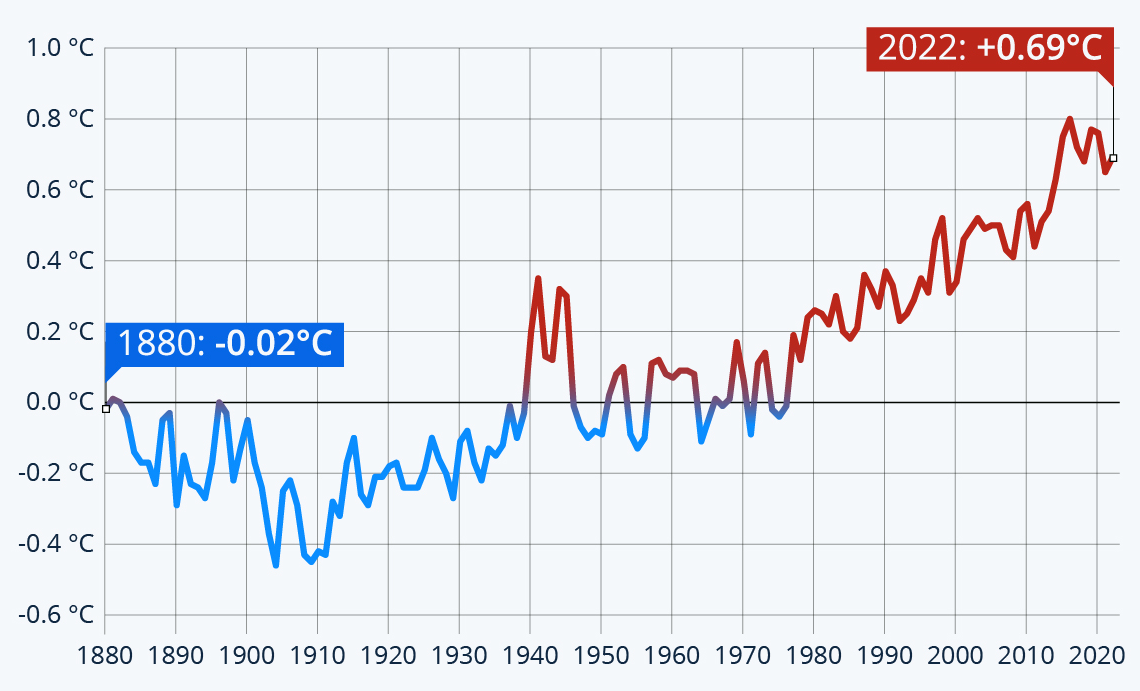 Figure 1: Global Ocean Surface Temperature Anomaly, 1880-2022. Data from the National Center for Environmental Information, (NCEI). Graph by Statista.