Urban heat islands, which grow along with the size of cities, create artificial warming at many long-term temperature stations.
On average, urban heat islands increase the global surface temperature trend by almost 50 percent.
Nearly 90 percent of U.S. temperature stations have been compromised by urbanization effects.
Almost half of the reported U.S. warming disappears when reporting only stations uncorrupted by heat islands.
Short Summary:
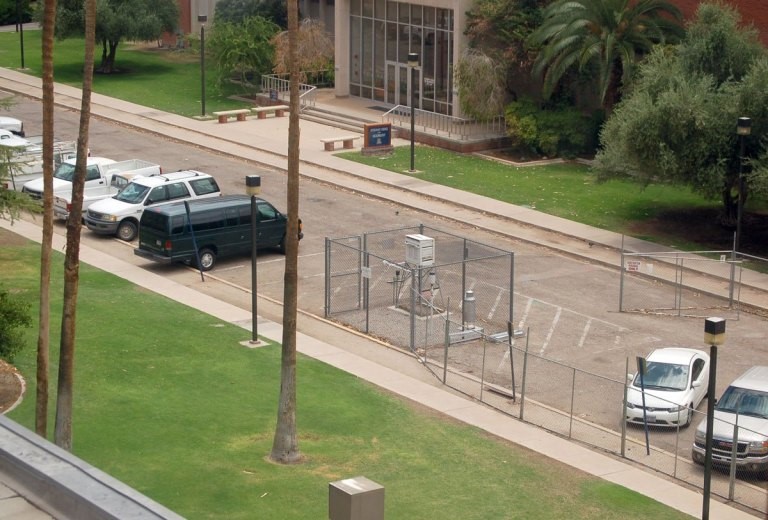
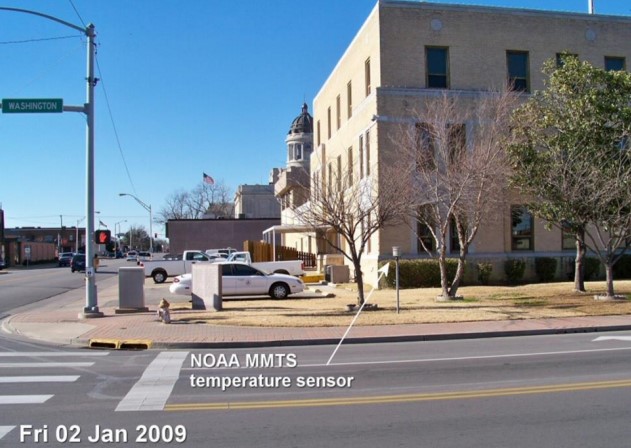
The majority of U.S. temperature stations utilized for the National Oceanic and Atmospheric Administration and NASA temperature records have been compromised by the encroachment of artificial surfaces like concrete, asphalt, buildings, and air conditioner exhausts. The effects of these manmade structures are often referred to as urban heat islands. (Figures 1 and 2 provide examples of how temperature stations have been compromised by urbanization.)
Figure 1. U.S. Historical Climatology Network weather station used to collect climate data. This station is located in a parking lot at the University of Arizona in Tucson. The station was previously located in a grassy area, but researchers moved the station as the campus grew. Photo by Anthony Watts.Figure 2. NOAA temperature sensor (used for climate data) located on street corner in Ardmore, Oklahoma. Note that the sensor’s data is being corrupted by heating signatures of the nearby building, asphalt, and automobiles. Photo by Anthony Watts.
Urban heat islands cause temperature data to display higher temperatures than what would have been recorded if the same stations were located away from urban areas. Some researchers have found urban heat islands are responsible for almost half of reported U.S. warming. When only non-urban temperature stations are used, warming trends are still present in the data, depending on the period examined, but they are minimal and not at all alarming.1
The data in Figure 3 show temperature stations that have not been corrupted by the urban heat island effect report significantly less warming than temperature stations corrupted by urban heat island impacts.2 Still, despite this well-known problem, corrupted temperature stations compose a majority of the stations used to report official U.S. temperature data.3
There is also strong evidence of similar siting problems in other parts of the world, including at many official weather stations. This suggests the same urban heat island corruptions that have occurred in U.S. data are also present in data compiled from other countries. Researchers at the Oak Ridge National Laboratory confirmed this theory in important work published in 2019.5
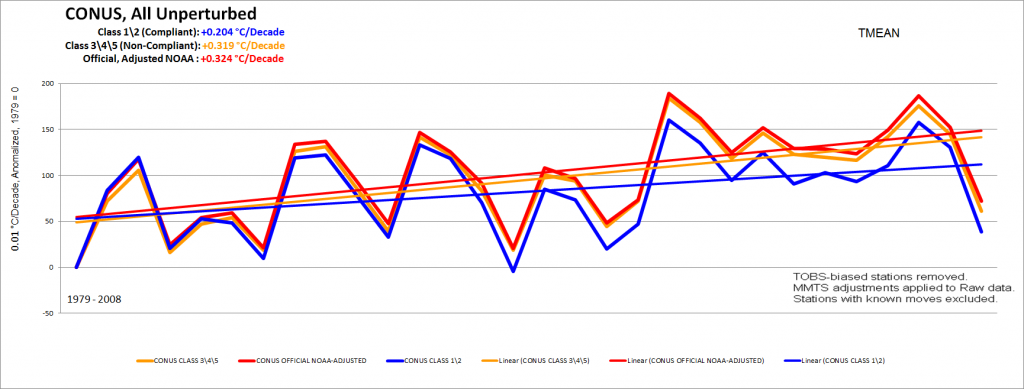
Figure 3, below, shows that temperature stations that have not been corrupted by urban heat island impacts report much less warming than temperature stations corrupted by urban heat island impacts. Yet, corrupted temperature stations are a majority of the stations used to report official U.S. temperature data.
Figure 3. A Comparison of Corrupted and Uncorrupted Temperature Station Data
Figure 3. Uncorrupted stations (classes one and two) report much less warming than stations corrupted by urban heat island factors (classes three, four, and five). Source: Anthony Watts
Ronald D. Leeper et al., “Impacts of Small-Scale Urban Encroachment on Air Temperature Observations,” Journal of the American Meteorological Society, Volume 58, Issue 6, June 1, 2019, https://journals.ametsoc.org/doi/10.1175/JAMC-D-19-0002.1
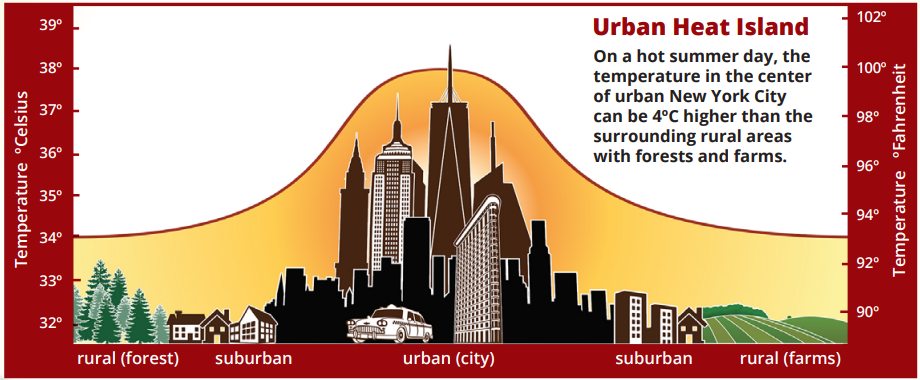
Climate At A Glance is a Project of The Heartland Institute View this page in our printable booklet (PDF) here. Email: think@heartland.org An illustration of the Urban Heat Island effect. Image: NOAA/NWS.
Urban heat islands, which grow along with the size of cities, create artificial warming at many long-term temperature stations.
On average, urban heat islands increase the global surface temperature trend by almost 50 percent.
Nearly 90 percent of U.S. temperature stations have been compromised by urbanization effects.
Almost half of the reported U.S. warming disappears when reporting only stations uncorrupted by heat islands.
Short Summary:
The majority of U.S. temperature stations utilized for the National Oceanic and Atmospheric Administration and NASA temperature records have been compromised by the encroachment of artificial surfaces like concrete, asphalt, buildings, and air conditioner exhausts. The effects of these manmade structures are often referred to as urban heat islands. (Figures 1 and 2 provide examples of how temperature stations have been compromised by urbanization.)
Figure 1. U.S. Historical Climatology Network weather station used to collect climate data. This station is located in a parking lot at the University of Arizona in Tucson. The station was previously located in a grassy area, but researchers moved the station as the campus grew. Photo by Anthony Watts.Figure 2. NOAA temperature sensor (used for climate data) located on street corner in Ardmore, Oklahoma. Note that the sensor’s data is being corrupted by heating signatures of the nearby building, asphalt, and automobiles. Photo by Anthony Watts.
Urban heat islands cause temperature data to display higher temperatures than what would have been recorded if the same stations were located away from urban areas. Some researchers have found urban heat islands are responsible for almost half of reported U.S. warming. When only non-urban temperature stations are used, warming trends are still present in the data, depending on the period examined, but they are minimal and not at all alarming.1
The data in Figure 3 show temperature stations that have not been corrupted by the urban heat island effect report significantly less warming than temperature stations corrupted by urban heat island impacts.2 Still, despite this well-known problem, corrupted temperature stations compose a majority of the stations used to report official U.S. temperature data.3
There is also strong evidence of similar siting problems in other parts of the world, including at many official weather stations. This suggests the same urban heat island corruptions that have occurred in U.S. data are also present in data compiled from other countries. Researchers at the Oak Ridge National Laboratory confirmed this theory in important work published in 2019.5
Figure 3, below, shows that temperature stations that have not been corrupted by urban heat island impacts report much less warming than temperature stations corrupted by urban heat island impacts. Yet, corrupted temperature stations are a majority of the stations used to report official U.S. temperature data.
Figure 3. A Comparison of Corrupted and Uncorrupted Temperature Station Data
Figure 3. Uncorrupted stations (classes one and two) report much less warming than stations corrupted by urban heat island factors (classes three, four, and five). Source: Anthony Watts
Ronald D. Leeper et al., “Impacts of Small-Scale Urban Encroachment on Air Temperature Observations,” Journal of the American Meteorological Society, Volume 58, Issue 6, June 1, 2019, https://journals.ametsoc.org/doi/10.1175/JAMC-D-19-0002.1
Climate At A Glance is a Project of The Heartland Institute View this page in our printable booklet (PDF) here. Email: think@heartland.org An illustration of the Urban Heat Island effect. Image: NOAA/NWS.
We use cookies to ensure that we give you the best experience on our website. If you continue to use this site we will assume that you are happy with it.Ok