Average temperatures have risen modestly in Colorado since 1900, driven largely by a decline in the number of frigid, subzero temperature nights.
There is no significant change in rainfall, drought, or heavy precipitation events.
Wildfires have not become more common or larger in size.
Major crops have seen massive increases over the same period warming has occurred.
Short Summary:
Temperature Trends:
Colorado is dominated by a cold, arid climate, both in the lowlands where there is grassland and semi-desert areas, and up in the mountains where conditions are subarctic. Summers are generally mild and at higher altitudes precipitation can be expected at any time of the year as either rain or snow.1
Average temperatures have risen 2.5°F since 1900 and, unlike many states, the number of days classified as “very hot” for Colorado, those with highs of 95°F or higher, have increased since 1900. However, they are comparable to highs throughout the 1930s.2
Part of this warming is due to urbanization, demonstrated by the fact that the places experiencing the greatest recorded warming also happen to be along the Colorado Front Range, which contains the state’s largest cities like Denver, Boulder, and Fort Collins.3 The Urban Heat Island effect is well documented, and occurs in places where the amount of artificial sources of heat retention like concrete and asphalt are growing, created an area of localized artificial warming that skews average temperatures upwards beyond natural warming.4
The San Luis Valley, which is underdeveloped and primarily agricultural, has seen significantly fewer subzero nights, but no trend in hotter days.5
The number of nights where lows are 0°F or lower has declined gradually over the same period, which is a significant benefit. As data show, extreme cold is much deadlier to humans than extreme heat.6 At the same time, the number of nights with lows of 70°F or higher has not increased.
Precipitation:
Annual precipitation in Colorado varies from year to year. There is no significant long-term trend.7
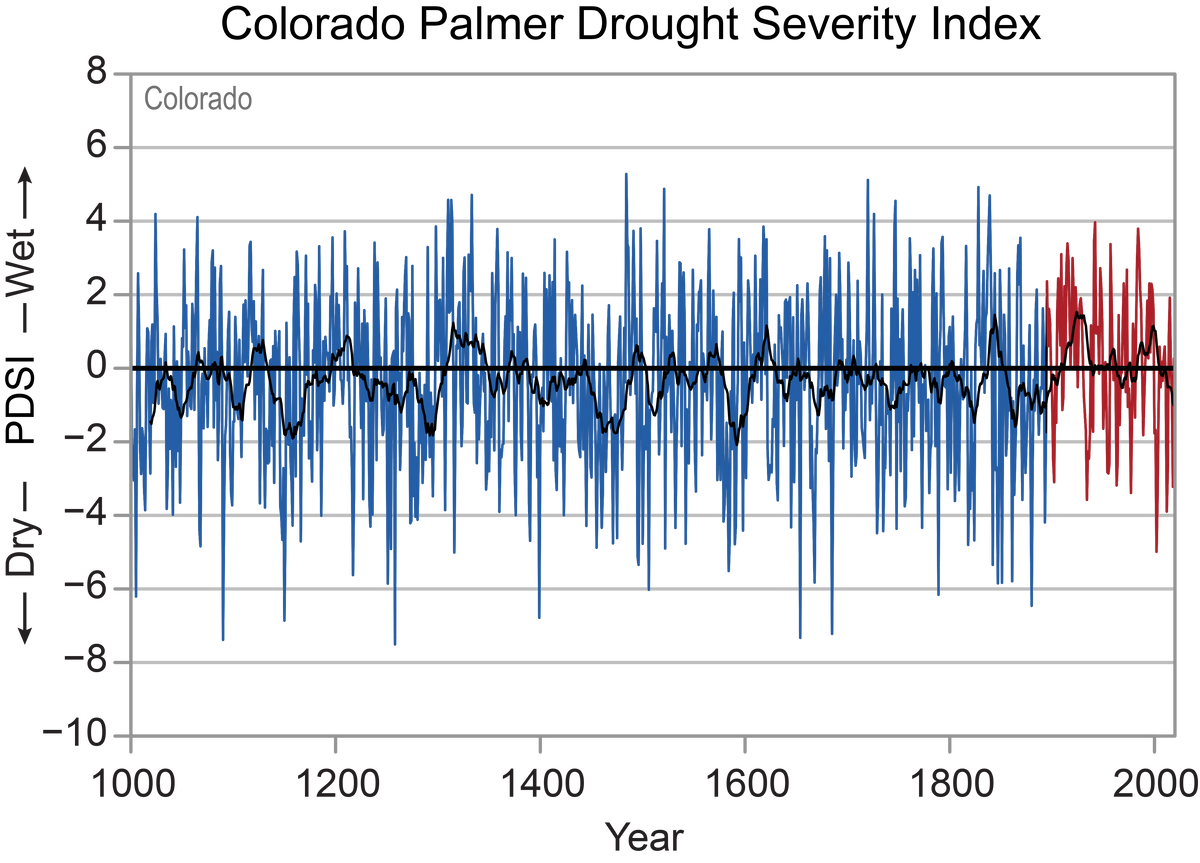
Recent drought is not historically unusual, as proxy data going back to the year 1000 show Colorado has experienced periods of severe and lasting drought in the past that was worse than today.8
Figure 1: Palmer Drought Severity Index timeseries from 1000 – 2020. Blue values are from proxy data, while the red are direct modern measurements. The black line is a 20-year running average. Chart from Colorado State Climate Summary by Frankson et al.
Recent prolonged droughts are like those that occurred in Colorado long before human emissions of greenhouse gases.
State-Specific Issues:
Snow
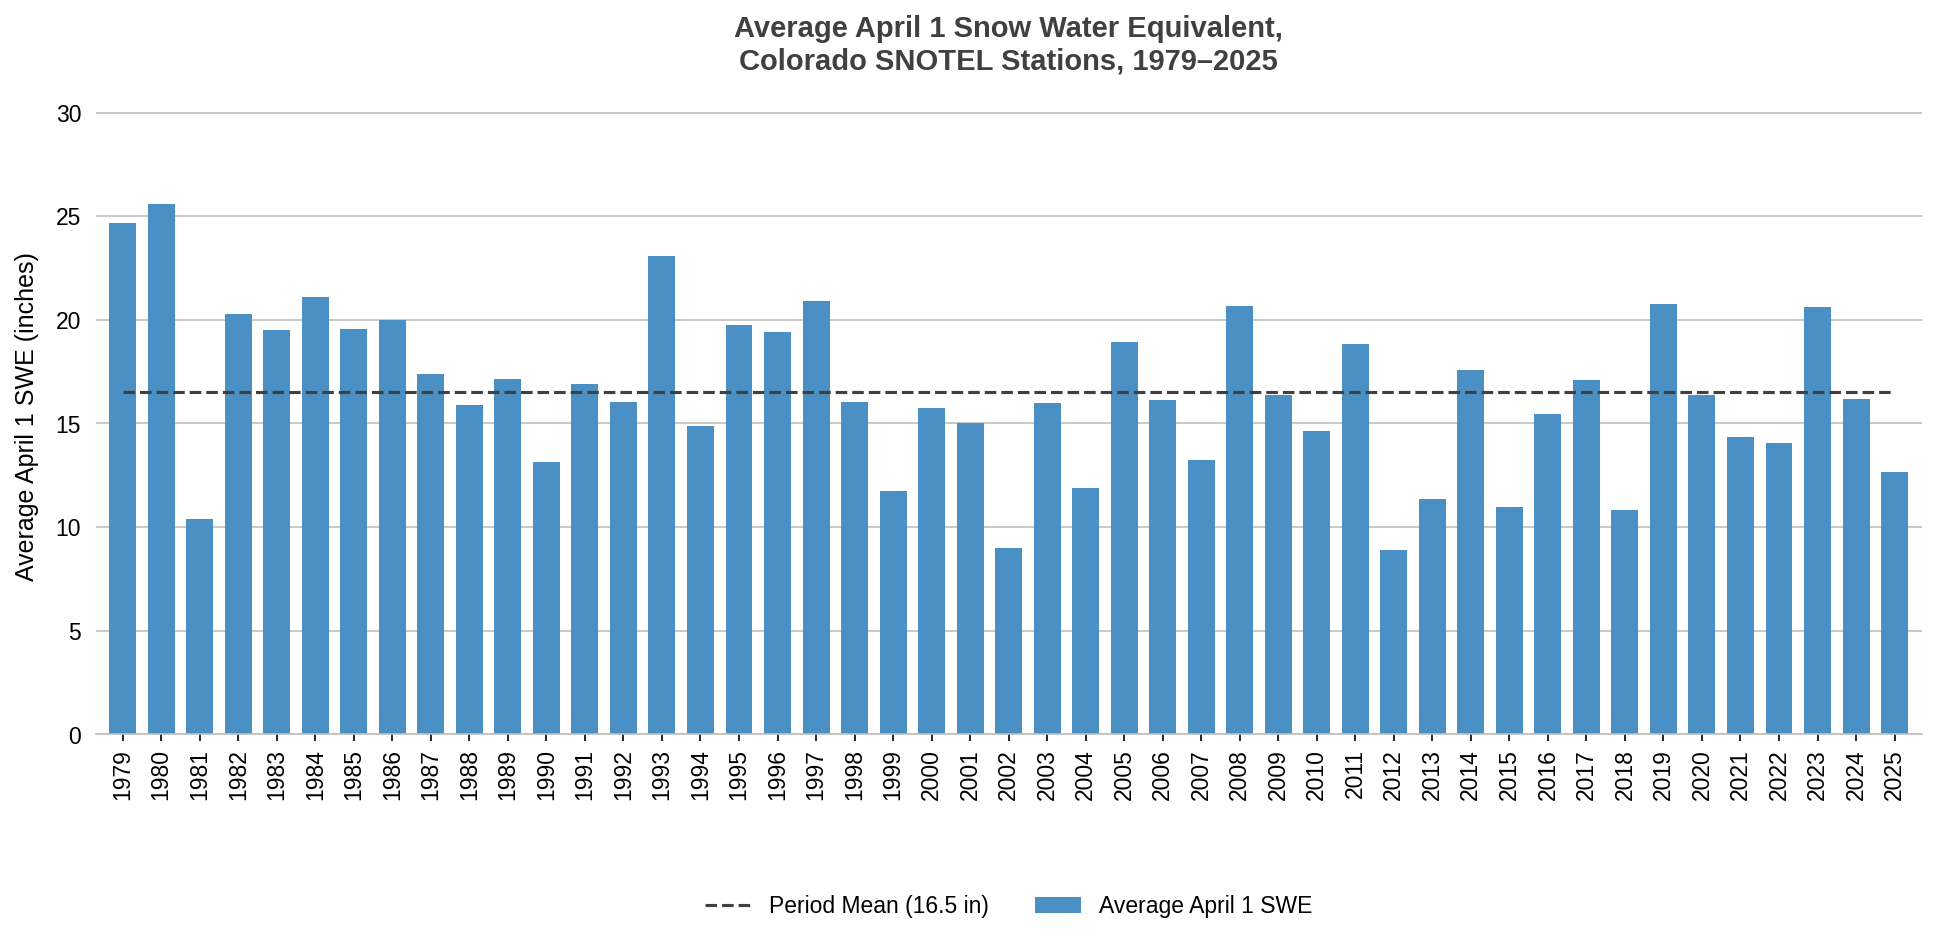
Since Colorado is famous for skiing, snow is important to the state. Data show that snow water equivalent (a metric for measuring snow and the water that it holds) has not substantially declined in recent decades.9
Figure 2: Average April 1 Snow Water Equivalent, Colorado SNOTEL Stations, 1979–2025. Data from Natural Resources Conservation Service, SNOTEL Network, WTEQ Start of Day Values, accessed February 2026, https://www.nrcs.usda.gov/resources/data-and-reports/snow-and-climate-monitoring-predefined-reports-and-maps
Wildfires
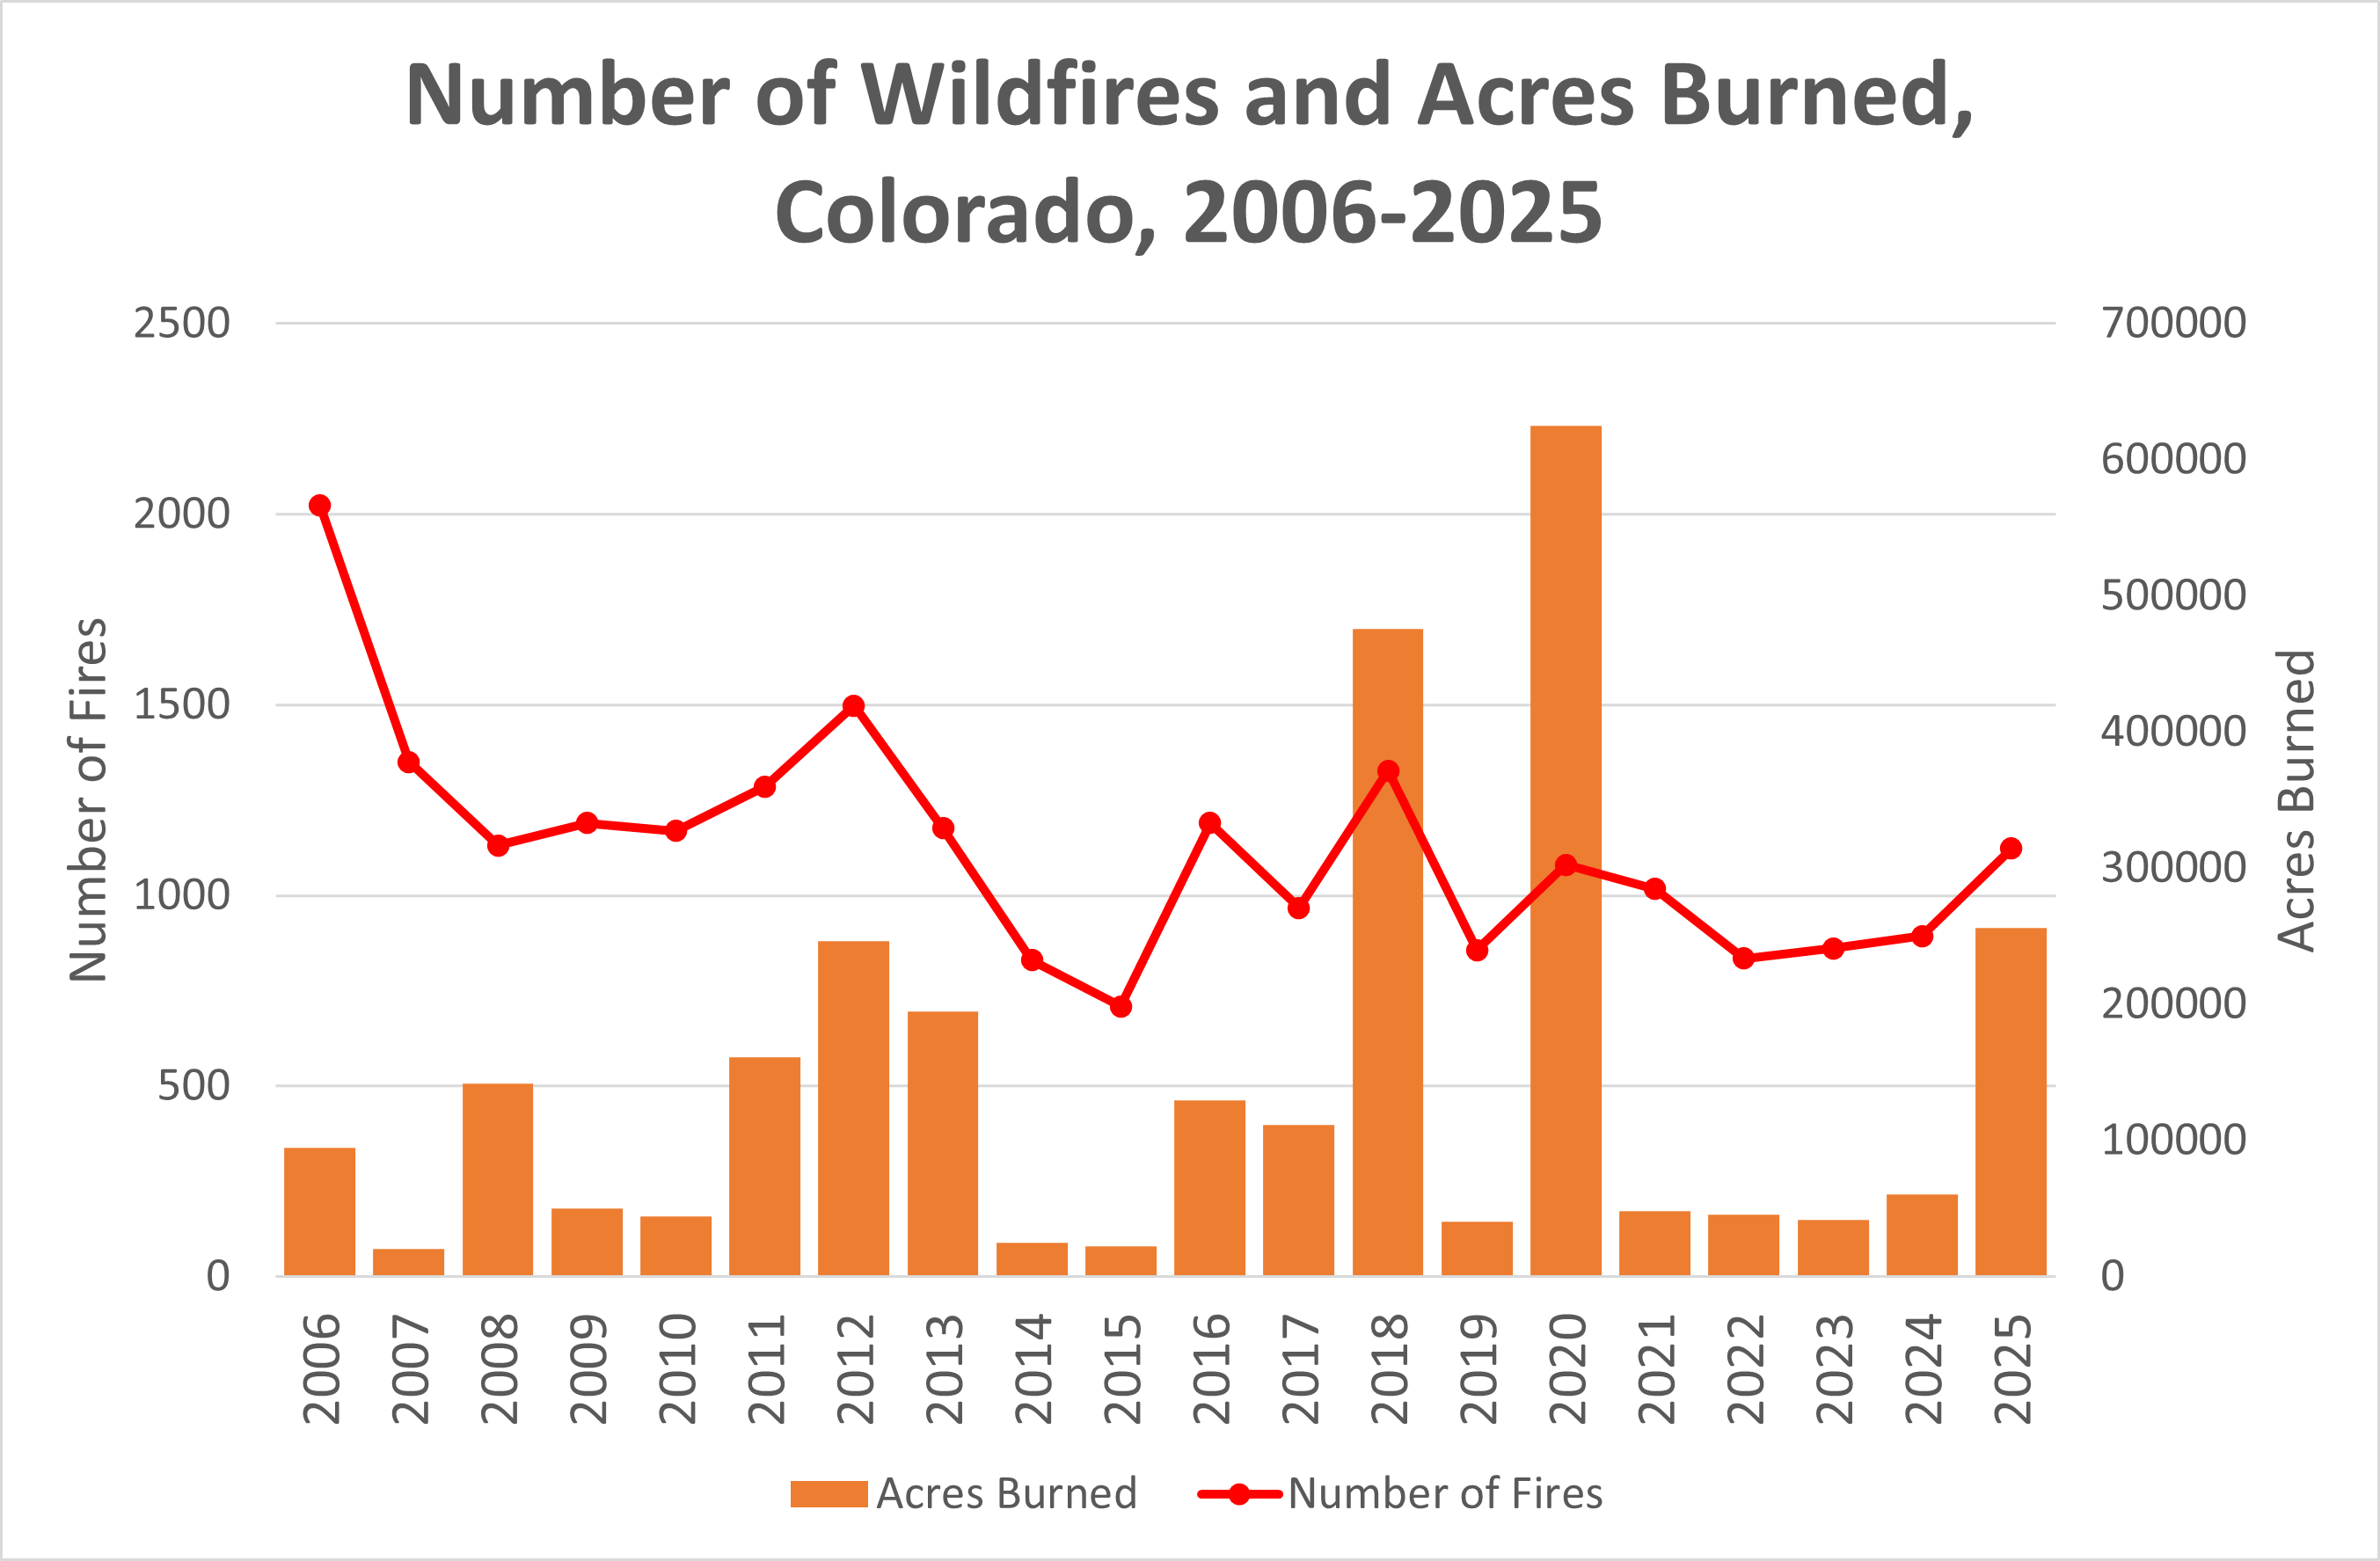
Colorado, like much of the West, is very prone to wildfires due to its forest density and dryness. Even though the state has experienced significant drought in recent years, available data going back to 2006 from the Department of the Interior’s National Interagency Fire Center does not show wildfires have become more common or larger.10 The only discernable trend is a slight decline in the number of wildfires occurring annually since 2006.
Figure 3: Number of wildfires (red line) and number of acres burned (orange bars) per year in Colorado from 2006 to 2025. Data from NICC Annual Reports.
Agriculture:
Colorado’s agricultural sector is dominated by cattle, which are fed by local corn, hay, and winter wheat.
Corn production has increased by more than 9,000 percent since 1900, over the same period that modest warming has occurred. Yields have increased 618 percent, partially due to technological improvements and carbon dioxide fertilization.11
Hay has also experienced increases in production and yields, at 57 percent and 61 percent, respectively.12
Winter wheat production rose 1173 percent since 1900, and yield increased by 111 percent.13
As for the cows, production data by weight only goes back to 1988, but has increased by around 6 percent.14
Conclusion:
All the above data considered, Colorado is clearly not suffering ecological or climate collapse due to the modest warming that has occurred over the past hundred-plus years. Deadly cold extremes have declined, precipitation conditions swing the way they have since well before the industrial revolution, and crop and cattle production have increased significantly.
Bolinger, R.A., J.J. Lukas, R.S. Schumacher, and P.E. Goble, Colorado State University, “Climate Change in Colorado, 3rd edition,” https://doi.org/10.25675/10217/237323
Qi Zhao, et al., “Global, regional, and national burden of mortality associated with non-optimal ambient temperatures from 2000 to 2019: a three-stage modelling study,” The Lancet Planetary Health, July 2021, accessed February 25, 2026, https://doi.org/10.1016/S2542-5196(21)00081-4
Frankson, R., K.E. Kunkel, L.E. Stevens, D.R. Easterling, N.A. Umphlett, C.J. Stiles, R. Schumacher, and P.E. Goble,“Colorado State Climate Summary 2022,” NOAA Technical Report, https://statesummaries.ncics.org/chapter/co/
Ibid.
Natural Resources Conservation Service, “Snow Water Equivalent (WTEQ) Start of Day Values,” SNOTEL Network, Colorado, 1979–2026, accessed February 27, 2026, https://www.nrcs.usda.gov/wps/portal/wcc/home
Average temperatures have risen modestly in Colorado since 1900, driven largely by a decline in the number of frigid, subzero temperature nights.
There is no significant change in rainfall, drought, or heavy precipitation events.
Wildfires have not become more common or larger in size.
Major crops have seen massive increases over the same period warming has occurred.
Short Summary:
Temperature Trends:
Colorado is dominated by a cold, arid climate, both in the lowlands where there is grassland and semi-desert areas, and up in the mountains where conditions are subarctic. Summers are generally mild and at higher altitudes precipitation can be expected at any time of the year as either rain or snow.1
Average temperatures have risen 2.5°F since 1900 and, unlike many states, the number of days classified as “very hot” for Colorado, those with highs of 95°F or higher, have increased since 1900. However, they are comparable to highs throughout the 1930s.2
Part of this warming is due to urbanization, demonstrated by the fact that the places experiencing the greatest recorded warming also happen to be along the Colorado Front Range, which contains the state’s largest cities like Denver, Boulder, and Fort Collins.3 The Urban Heat Island effect is well documented, and occurs in places where the amount of artificial sources of heat retention like concrete and asphalt are growing, created an area of localized artificial warming that skews average temperatures upwards beyond natural warming.4
The San Luis Valley, which is underdeveloped and primarily agricultural, has seen significantly fewer subzero nights, but no trend in hotter days.5
The number of nights where lows are 0°F or lower has declined gradually over the same period, which is a significant benefit. As data show, extreme cold is much deadlier to humans than extreme heat.6 At the same time, the number of nights with lows of 70°F or higher has not increased.
Precipitation:
Annual precipitation in Colorado varies from year to year. There is no significant long-term trend.7
Recent drought is not historically unusual, as proxy data going back to the year 1000 show Colorado has experienced periods of severe and lasting drought in the past that was worse than today.8
Figure 1: Palmer Drought Severity Index timeseries from 1000 – 2020. Blue values are from proxy data, while the red are direct modern measurements. The black line is a 20-year running average. Chart from Colorado State Climate Summary by Frankson et al.
Recent prolonged droughts are like those that occurred in Colorado long before human emissions of greenhouse gases.
State-Specific Issues:
Snow
Since Colorado is famous for skiing, snow is important to the state. Data show that snow water equivalent (a metric for measuring snow and the water that it holds) has not substantially declined in recent decades.9
Figure 2: Average April 1 Snow Water Equivalent, Colorado SNOTEL Stations, 1979–2025. Data from Natural Resources Conservation Service, SNOTEL Network, WTEQ Start of Day Values, accessed February 2026, https://www.nrcs.usda.gov/resources/data-and-reports/snow-and-climate-monitoring-predefined-reports-and-maps
Wildfires
Colorado, like much of the West, is very prone to wildfires due to its forest density and dryness. Even though the state has experienced significant drought in recent years, available data going back to 2006 from the Department of the Interior’s National Interagency Fire Center does not show wildfires have become more common or larger.10 The only discernable trend is a slight decline in the number of wildfires occurring annually since 2006.
Figure 3: Number of wildfires (red line) and number of acres burned (orange bars) per year in Colorado from 2006 to 2025. Data from NICC Annual Reports.
Agriculture:
Colorado’s agricultural sector is dominated by cattle, which are fed by local corn, hay, and winter wheat.
Corn production has increased by more than 9,000 percent since 1900, over the same period that modest warming has occurred. Yields have increased 618 percent, partially due to technological improvements and carbon dioxide fertilization.11
Hay has also experienced increases in production and yields, at 57 percent and 61 percent, respectively.12
Winter wheat production rose 1173 percent since 1900, and yield increased by 111 percent.13
As for the cows, production data by weight only goes back to 1988, but has increased by around 6 percent.14
Conclusion:
All the above data considered, Colorado is clearly not suffering ecological or climate collapse due to the modest warming that has occurred over the past hundred-plus years. Deadly cold extremes have declined, precipitation conditions swing the way they have since well before the industrial revolution, and crop and cattle production have increased significantly.
Bolinger, R.A., J.J. Lukas, R.S. Schumacher, and P.E. Goble, Colorado State University, “Climate Change in Colorado, 3rd edition,” https://doi.org/10.25675/10217/237323
Qi Zhao, et al., “Global, regional, and national burden of mortality associated with non-optimal ambient temperatures from 2000 to 2019: a three-stage modelling study,” The Lancet Planetary Health, July 2021, accessed February 25, 2026, https://doi.org/10.1016/S2542-5196(21)00081-4
Frankson, R., K.E. Kunkel, L.E. Stevens, D.R. Easterling, N.A. Umphlett, C.J. Stiles, R. Schumacher, and P.E. Goble,“Colorado State Climate Summary 2022,” NOAA Technical Report, https://statesummaries.ncics.org/chapter/co/
Ibid.
Natural Resources Conservation Service, “Snow Water Equivalent (WTEQ) Start of Day Values,” SNOTEL Network, Colorado, 1979–2026, accessed February 27, 2026, https://www.nrcs.usda.gov/wps/portal/wcc/home
We use cookies to ensure that we give you the best experience on our website. If you continue to use this site we will assume that you are happy with it.