Minnesota has experienced a decrease in the number of hot days over the past few decades.
A decline in the number of “very cold” days has contributed to the overall modest warming trend in the state.
Wildfires have declined over the past 19 years.
Major crops like corn and soybeans have experienced substantial growth.
Short Summary:
Temperature Trends:
Minnesota is dominated by humid continental and mild or hot summer conditions and cold winters, according to Köppen classification maps.1
Average temperatures have increased about 2.5°F since the beginning of the twentieth century, but most of this temperature increase is driven not by an increase in hot days, but a decline in the number of extremely cold days.2
The decline in the number of very cold days or nights is likely due, in part, to the urban heat island effect than general air temperature warming. Minnesota’s cities and suburban areas have grown considerably over the past century, with population growth topping 230 percent. Heat sources associated with urbanization like concrete, brick, air conditioner and heating units, and other machinery contribute to localized increases in temperature.3
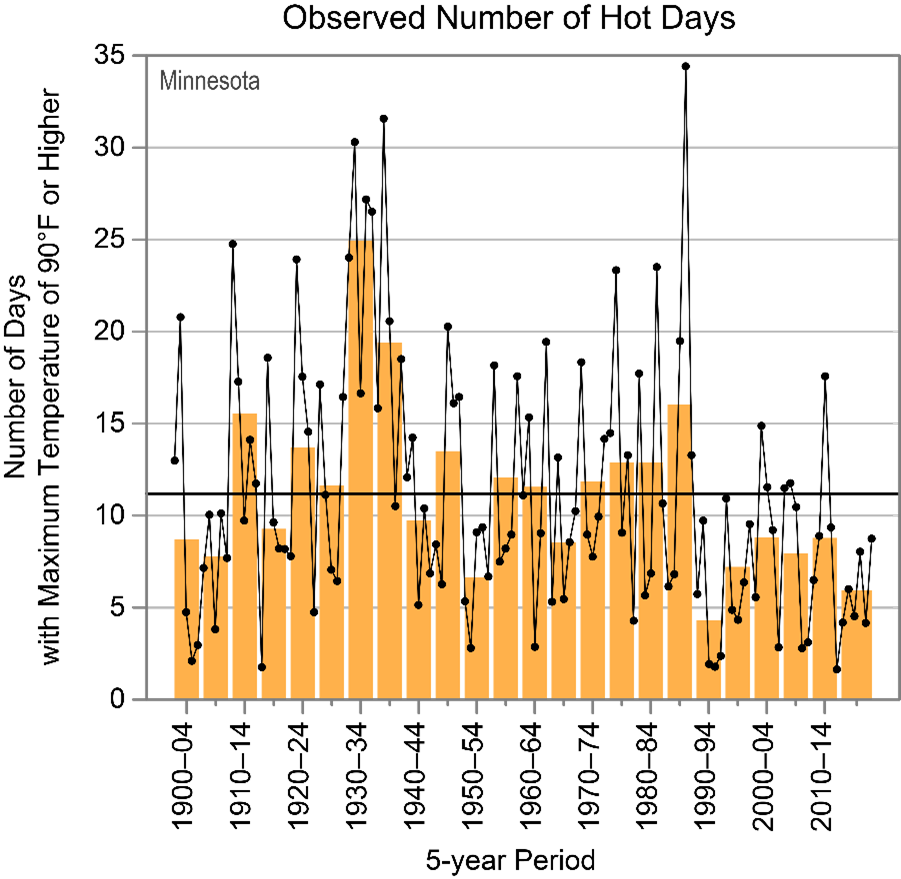
The number of very hot days, where maximum temperatures are 90°F or higher, have declined since the 1930s. Records show that there has also been a decline in the number of “very cold” days, days with maximum temperatures of 0°F or lower, since the 1960s. This accounts for some of the warming. The decline in extremely cold days is beneficial for human health, not a detriment. Cold temperatures are far more deadly than extremely hot temperatures,4 and since both conditions have trended downward for Minnesota, overall human health threats from extreme temperatures have declined.
Figure 1: Observed annual number of hot days with maximum temperatures of 90°F or higher from 1900 to 2020 in Minnesota.
Precipitation:
After a decline in annual precipitation from 1900 to 1930, Minnesota has seen a modest increase.5 Most precipitation in the state occurs as snow in winter. During the springtime, fewer late season frosts are beneficial for the agricultural growing season.
State-Specific Issues:
Wildfire
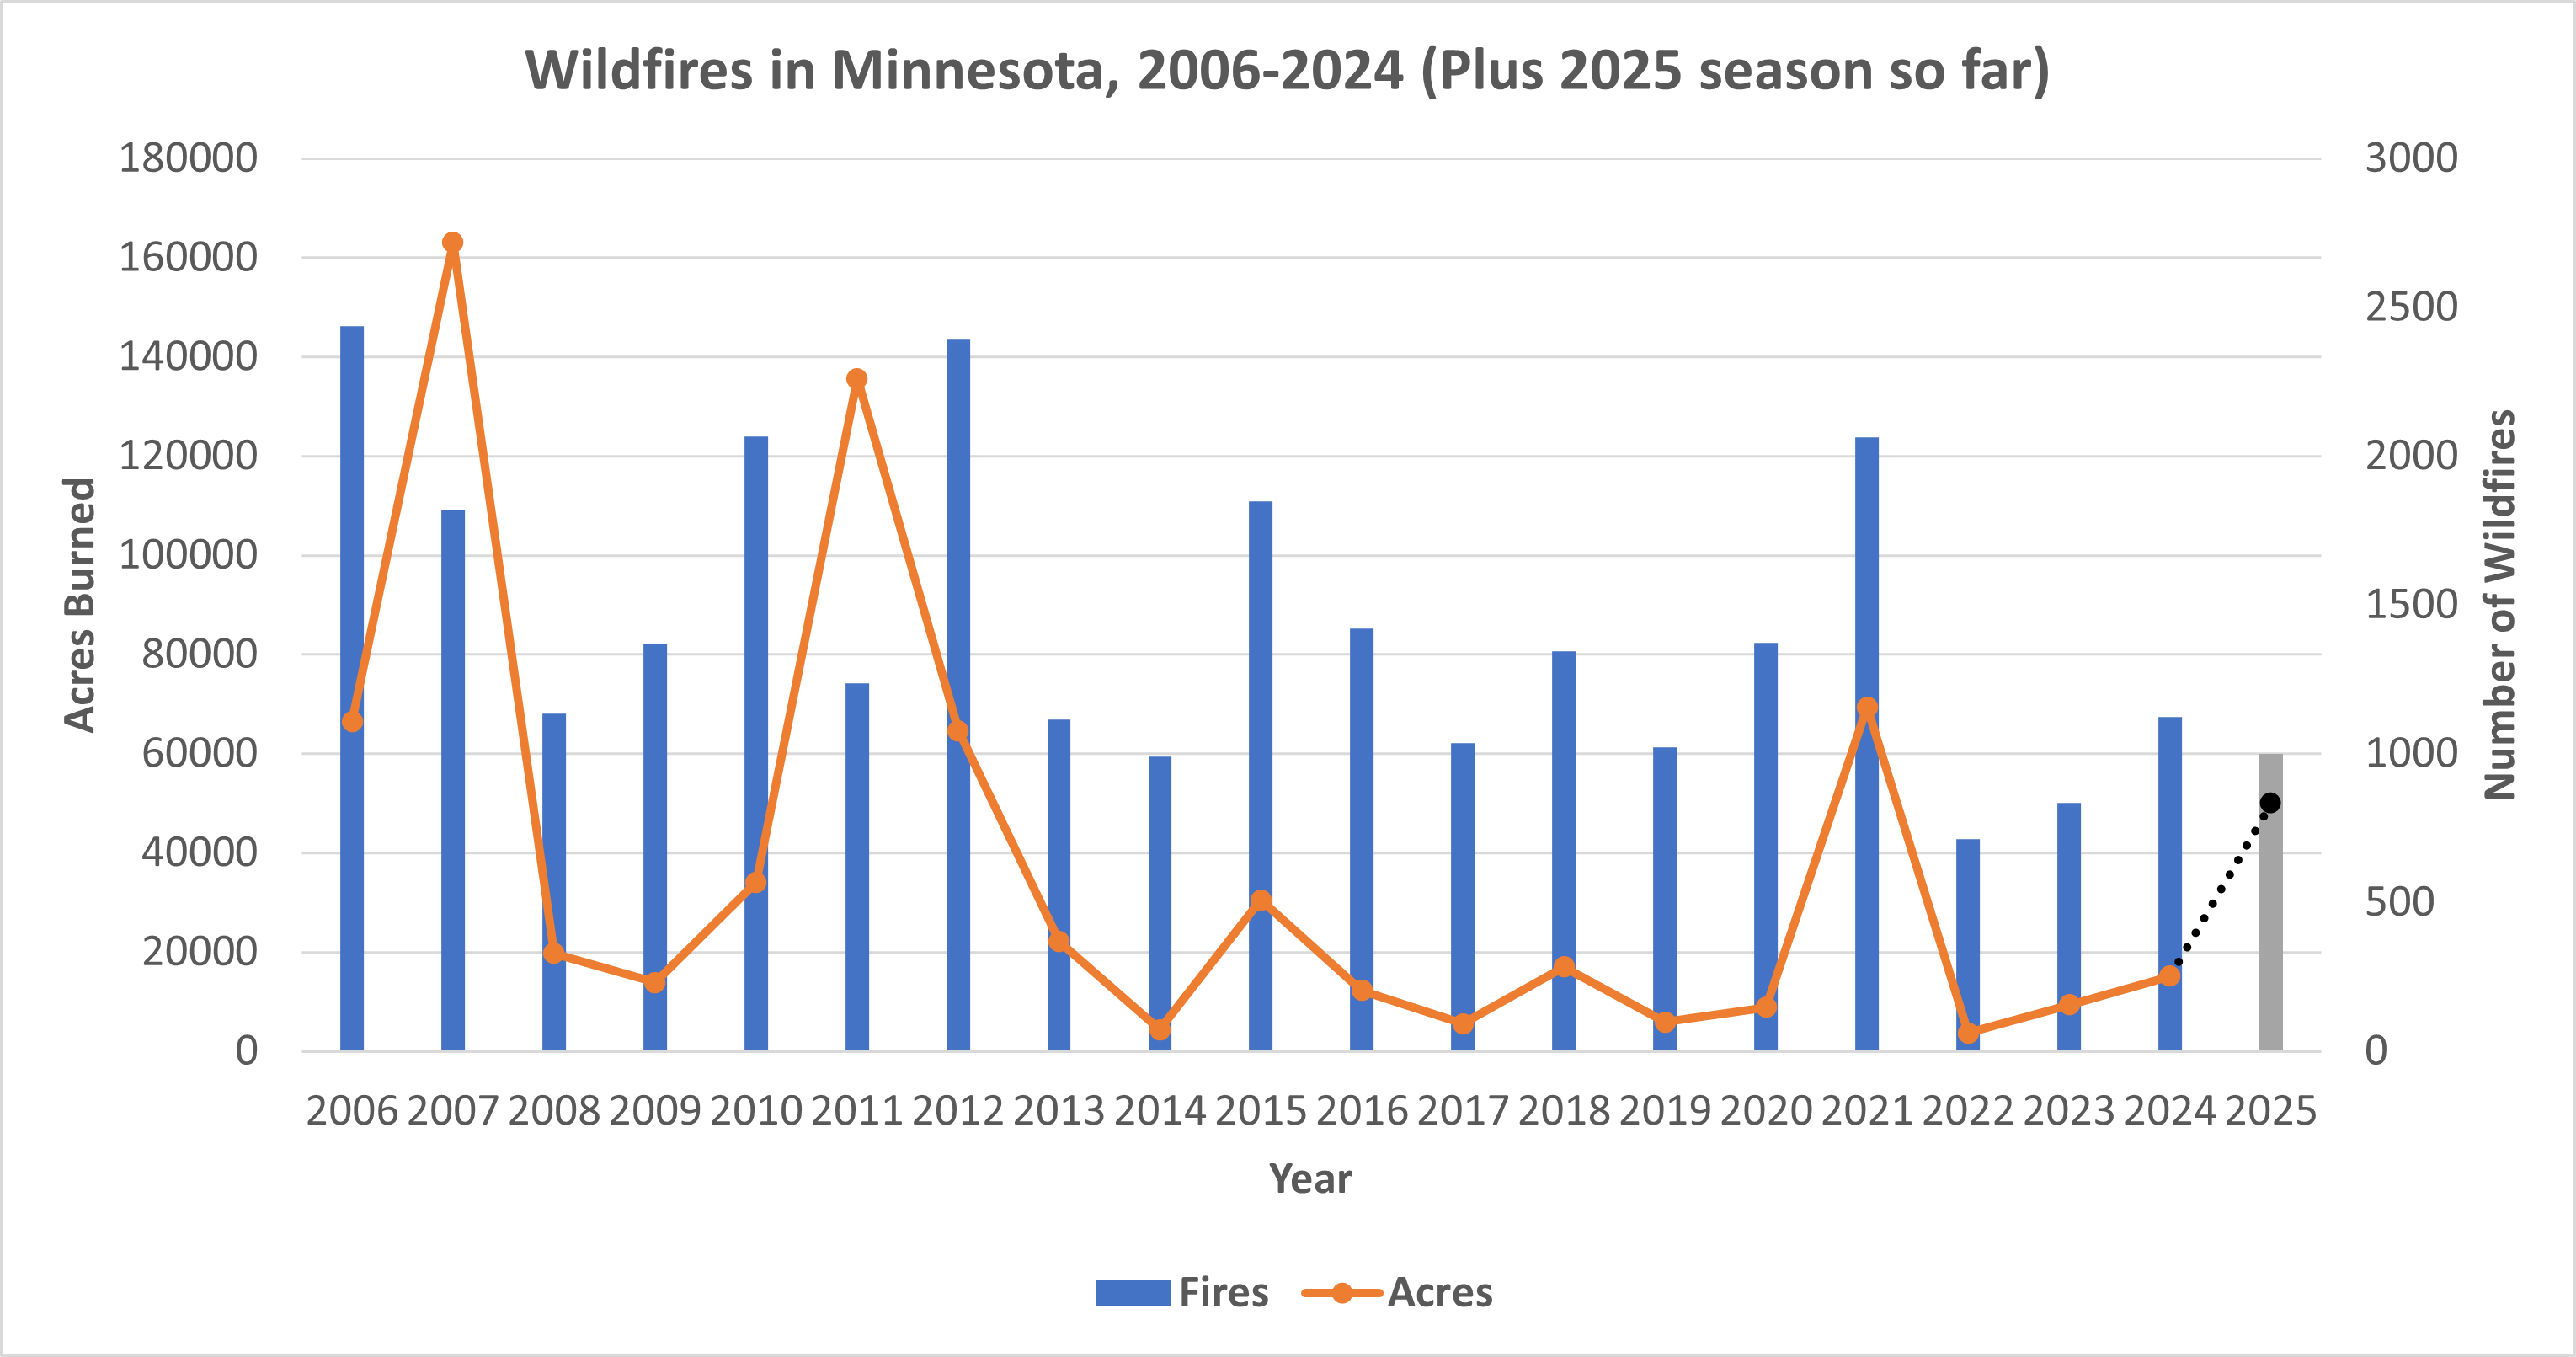
Minnesota is heavily forested, and therefore prone to wildfires. Data from the National Interagency Coordination Center, collected for Minnesota since 2006, show that both the number of acres lost to wildfires and the absolute number of fires have declined during the recent period of minor warming.6
Figure 2: Wildfires in Minnesota from 2006 – 2024, plus the season as of May 2025. Data from the National Interagency Coordination Center.
Tornadoes
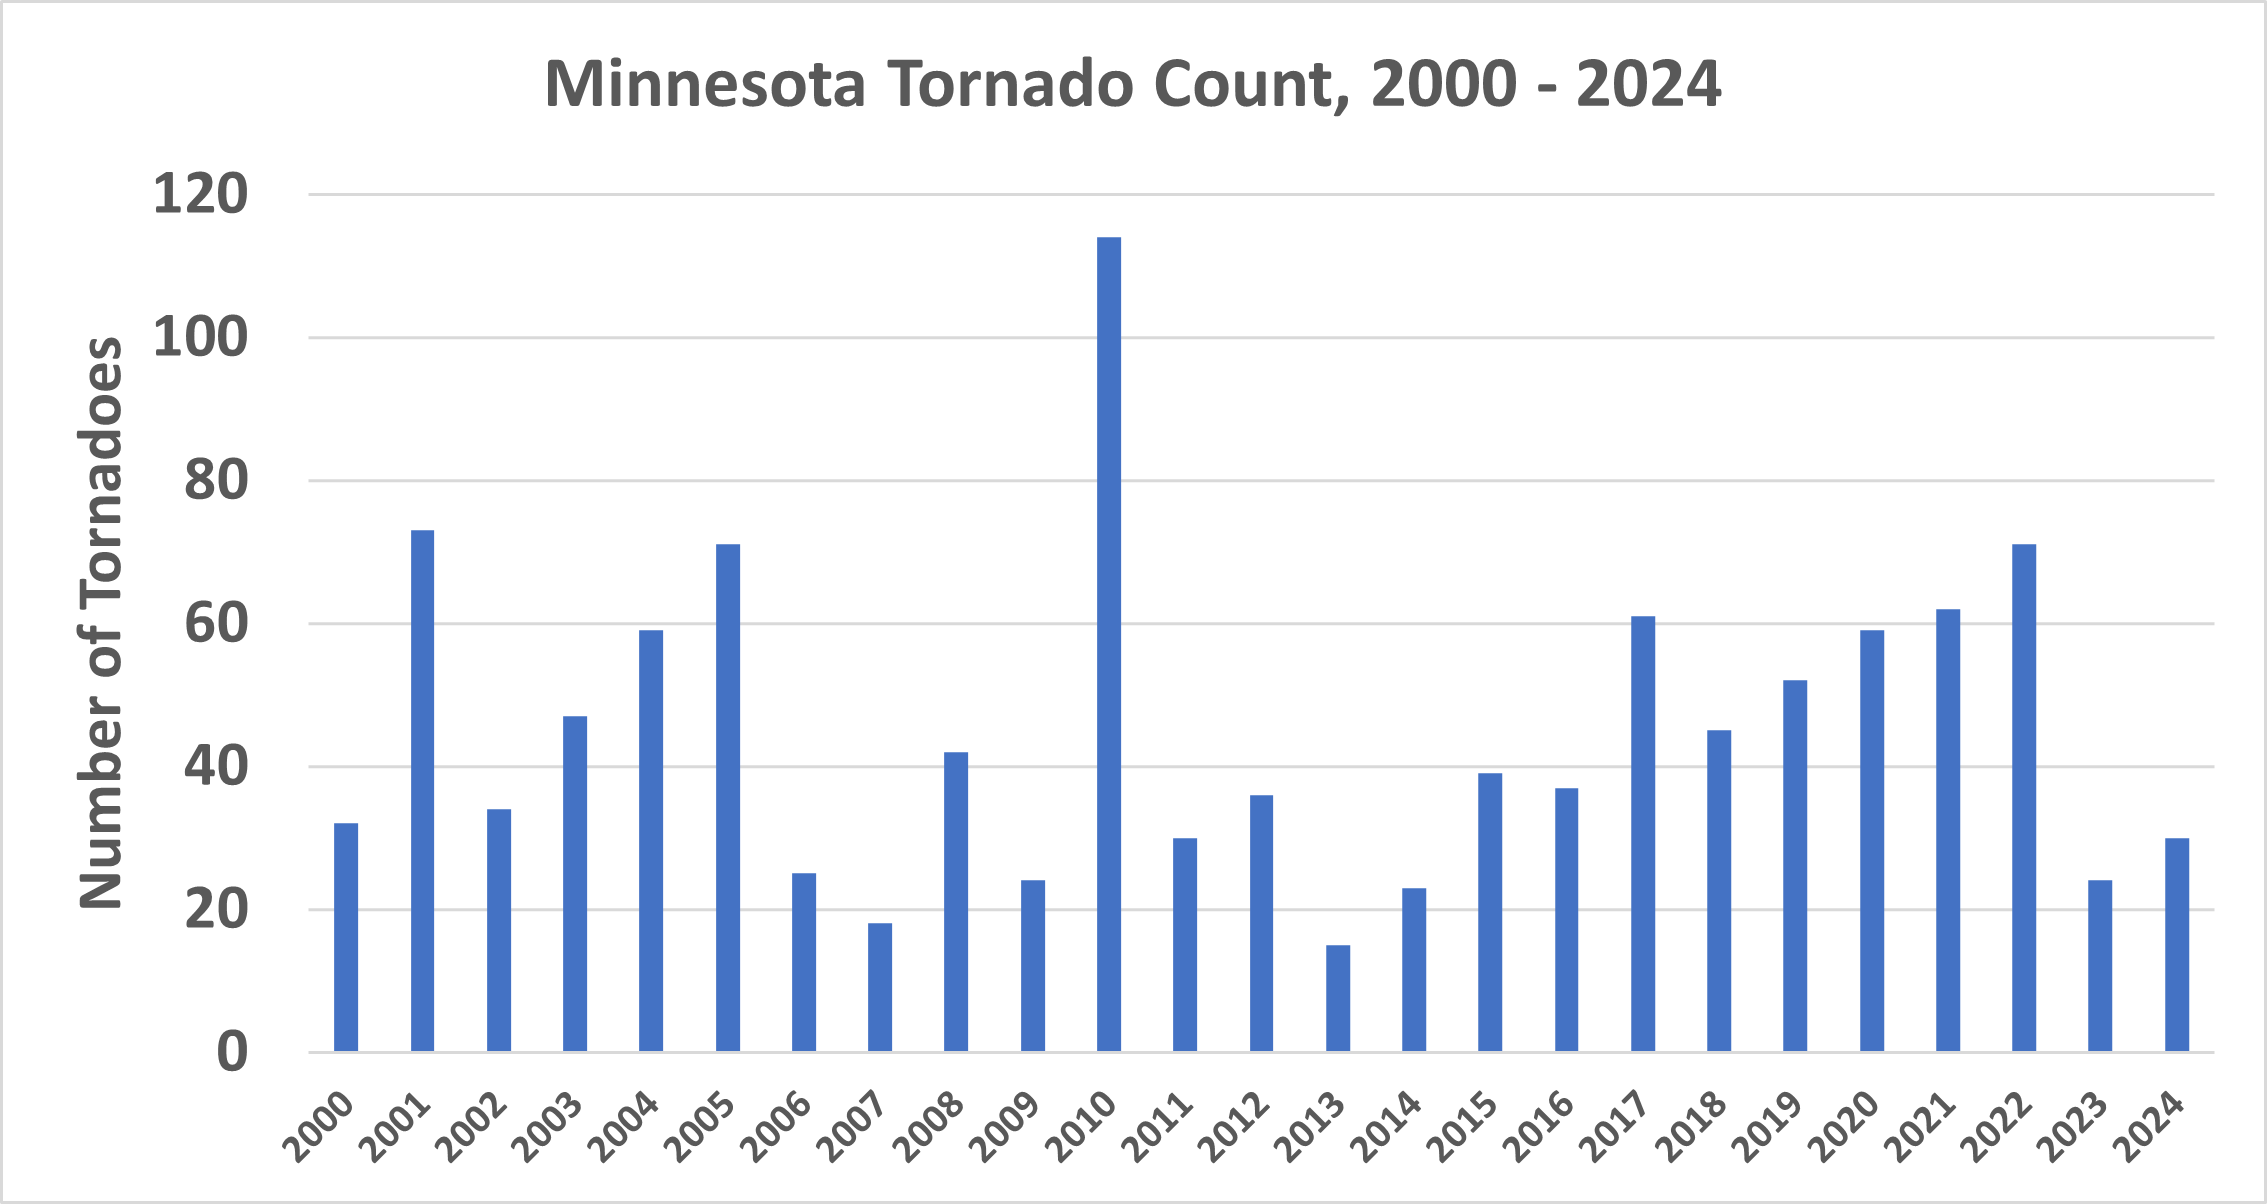
Minnesota is also vulnerable to thunderstorms, which often produce tornadoes. For more than 70 consecutive years, Minnesota has experienced at least one tornado outbreak.7 However, from 2000 to 2024, there is no trend in either increasing or decreasing numbers of tornados in the state.8
Figure 3: Number of tornadoes detected per year in Minnesota between 2000 and 2024. Data from the NOAA/National Weather Service Storm Prediction Center’s Annual Final Report Summaries. https://www.spc.noaa.gov/climo/summary/
Agriculture:
Soybeans, corn, and wheat are major agricultural crops in Minnesota. So are sugar beets, of which Minnesota produces more than any other state.
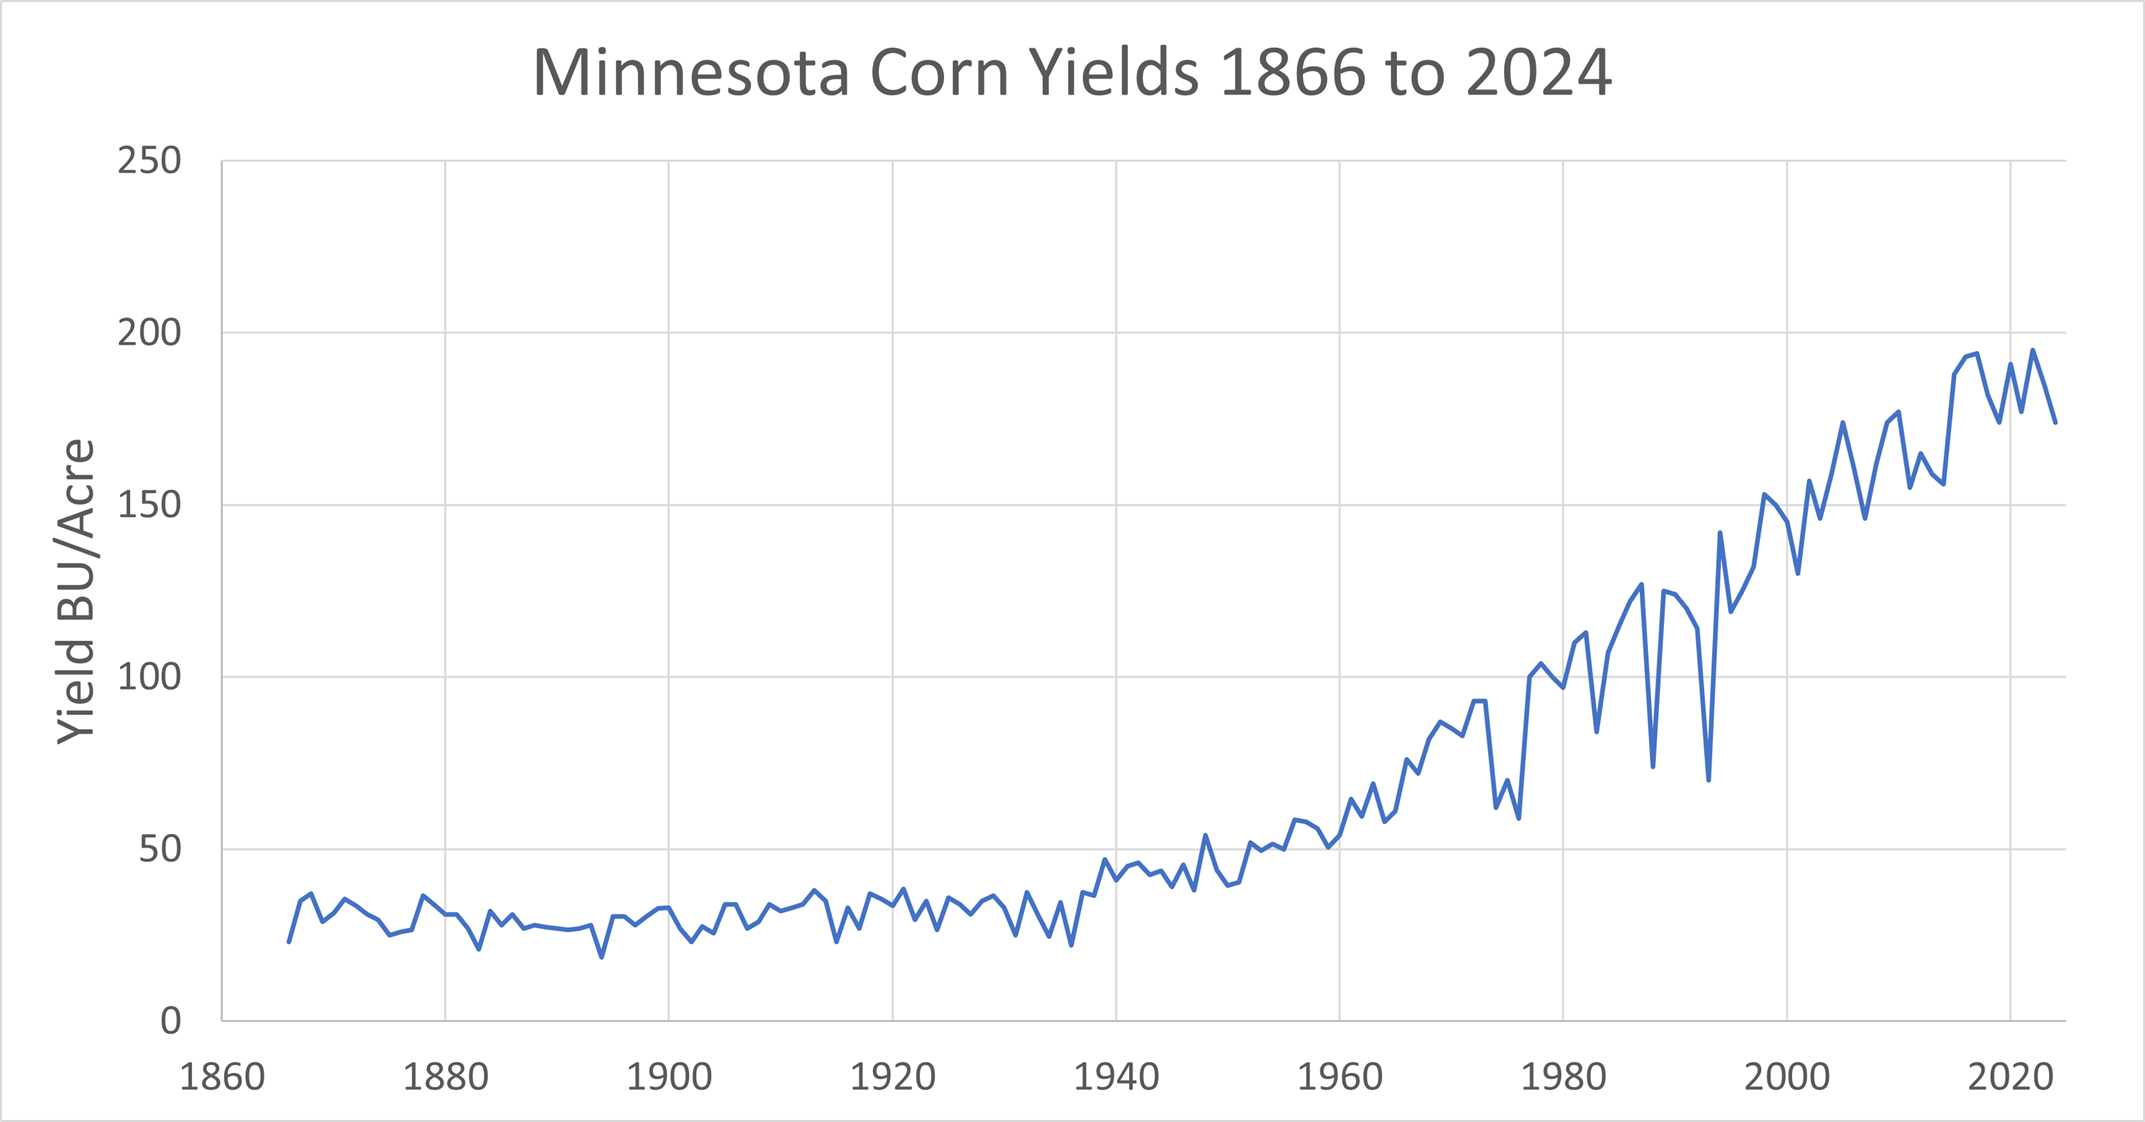
Minnesota has a very long record of corn production, with surveys going back to the 1860s. Over that period, corn yields have substantially increased from around 23 bushels per acre in 1866, to 174 in 2024.9 That represents a 656 percent increase in corn yields.
Figure 4: Corn yields in bushels per acre in Minnesota since 1866. Data from USDA/NASS QuickStats.
Minnesota’s soybean data goes back to the 1930s. Since then, yields have increased 200 percent.10
Wheat data shows a similar trend: yields have increased 372 percent since the 1860s.11
As for sugar beets, yields have increased an amazing 243 percent since 1924. The most recent all-time yield record occurred in 2021, and the all-time production record was set in 2023.12
Conclusion:
Despite thunderstorms and tornadoes, Minnesota has a generally mild climate compared to many other states. It has experienced no dangerous warming and continues to enjoy increased yields of major staple crops, likely due in part to a modest increase in spring precipitation and carbon dioxide fertilization. Data reveal no evidence that climate change is harming Minnesota’s economy or its people.
References:
“United States Koppen-Geiger Climate Classification Map.” plantmaps.com, January 20, 2024. https://www.plantmaps.com/koppen-climate-classification-map-united-states.php#google_vignette
Runkle, J., K.E. Kunkel, R. Frankson, D.R. Easterling, S.M. Champion, 2022: Minnesota State Climate Summary 2022. NOAA Technical Report NESDIS 150-MN. NOAA/NESDIS, Silver Spring, MD, 4 pp. https://statesummaries.ncics.org/chapter/mn/
Climate at a Glance: Urban Heat Islands. The Heartland Institute. https://climateataglance.com/climate-at-a-glance-urban-heat-islands/
Anthony Watts and James Taylor, ed. H. Sterling Burnett, Climate at a Glance: Temperature-Related Deaths, Heartland Institute, accessed June 10, 2025, https://climateataglance.com/climate-at-a-glance-temperature-related-deaths/.
Runkle, J. et al., Minnesota State Climate Summary 2022. NOAA Technical Report NESDIS 150-MN. NOAA/NESDIS, Silver Spring, MD, 4 pp.
“Intelligence: NICC Annual Reports.” National Interagency Fire Center. Accessed August 1, 2025. https://www.nifc.gov/nicc/predictive-services/intelligence
“Minnesota Tornado History and Statistics.” Minnesota Department of Natural Resources, July 2, 2025. https://www.dnr.state.mn.us/climate/summaries_and_publications/tornadoes.html
“Final Severe Weather Report Database.” NOAA/NWS Storm Prediction Center. Accessed August 6, 2025. https://www.spc.noaa.gov/climo/summary/
U.S. Department of Agriculture. (n.d.). Corn, grain yield data for Minnesota. USDA/NASS QuickStats. https://quickstats.nass.usda.gov/results/BABB0191-E2E0-33B5-A065-56202C6F6916
U.S. Department of Agriculture. (n.d.). Soybean yield data for Minnesota. USDA/NASS QuickStats https://quickstats.nass.usda.gov/results/0811BB83-0A48-392B-962A-F6F6E319D1AF
U.S. Department of Agriculture. (n.d.). Wheat yield data for Minnesota. USDA/NASS QuickStats https://quickstats.nass.usda.gov/results/CF2B6C3E-4525-380F-9A61-ABB9FF14B053
U.S. Department of Agriculture. (n.d.). Sugarbeet yield data for Minnesota. USDA/NASS QuickStats https://quickstats.nass.usda.gov/results/5430C13B-D137-32FA-AC68-AAD906A7D313
Minnesota has experienced a decrease in the number of hot days over the past few decades.
A decline in the number of “very cold” days has contributed to the overall modest warming trend in the state.
Wildfires have declined over the past 19 years.
Major crops like corn and soybeans have experienced substantial growth.
Short Summary:
Temperature Trends:
Minnesota is dominated by humid continental and mild or hot summer conditions and cold winters, according to Köppen classification maps.1
Average temperatures have increased about 2.5°F since the beginning of the twentieth century, but most of this temperature increase is driven not by an increase in hot days, but a decline in the number of extremely cold days.2
The decline in the number of very cold days or nights is likely due, in part, to the urban heat island effect than general air temperature warming. Minnesota’s cities and suburban areas have grown considerably over the past century, with population growth topping 230 percent. Heat sources associated with urbanization like concrete, brick, air conditioner and heating units, and other machinery contribute to localized increases in temperature.3
The number of very hot days, where maximum temperatures are 90°F or higher, have declined since the 1930s. Records show that there has also been a decline in the number of “very cold” days, days with maximum temperatures of 0°F or lower, since the 1960s. This accounts for some of the warming. The decline in extremely cold days is beneficial for human health, not a detriment. Cold temperatures are far more deadly than extremely hot temperatures,4 and since both conditions have trended downward for Minnesota, overall human health threats from extreme temperatures have declined.
Figure 1: Observed annual number of hot days with maximum temperatures of 90°F or higher from 1900 to 2020 in Minnesota.
Precipitation:
After a decline in annual precipitation from 1900 to 1930, Minnesota has seen a modest increase.5 Most precipitation in the state occurs as snow in winter. During the springtime, fewer late season frosts are beneficial for the agricultural growing season.
State-Specific Issues:
Wildfire
Minnesota is heavily forested, and therefore prone to wildfires. Data from the National Interagency Coordination Center, collected for Minnesota since 2006, show that both the number of acres lost to wildfires and the absolute number of fires have declined during the recent period of minor warming.6
Figure 2: Wildfires in Minnesota from 2006 – 2024, plus the season as of May 2025. Data from the National Interagency Coordination Center.
Tornadoes
Minnesota is also vulnerable to thunderstorms, which often produce tornadoes. For more than 70 consecutive years, Minnesota has experienced at least one tornado outbreak.7 However, from 2000 to 2024, there is no trend in either increasing or decreasing numbers of tornados in the state.8
Figure 3: Number of tornadoes detected per year in Minnesota between 2000 and 2024. Data from the NOAA/National Weather Service Storm Prediction Center’s Annual Final Report Summaries. https://www.spc.noaa.gov/climo/summary/
Agriculture:
Soybeans, corn, and wheat are major agricultural crops in Minnesota. So are sugar beets, of which Minnesota produces more than any other state.
Minnesota has a very long record of corn production, with surveys going back to the 1860s. Over that period, corn yields have substantially increased from around 23 bushels per acre in 1866, to 174 in 2024.9 That represents a 656 percent increase in corn yields.
Figure 4: Corn yields in bushels per acre in Minnesota since 1866. Data from USDA/NASS QuickStats.
Minnesota’s soybean data goes back to the 1930s. Since then, yields have increased 200 percent.10
Wheat data shows a similar trend: yields have increased 372 percent since the 1860s.11
As for sugar beets, yields have increased an amazing 243 percent since 1924. The most recent all-time yield record occurred in 2021, and the all-time production record was set in 2023.12
Conclusion:
Despite thunderstorms and tornadoes, Minnesota has a generally mild climate compared to many other states. It has experienced no dangerous warming and continues to enjoy increased yields of major staple crops, likely due in part to a modest increase in spring precipitation and carbon dioxide fertilization. Data reveal no evidence that climate change is harming Minnesota’s economy or its people.
References:
“United States Koppen-Geiger Climate Classification Map.” plantmaps.com, January 20, 2024. https://www.plantmaps.com/koppen-climate-classification-map-united-states.php#google_vignette
Runkle, J., K.E. Kunkel, R. Frankson, D.R. Easterling, S.M. Champion, 2022: Minnesota State Climate Summary 2022. NOAA Technical Report NESDIS 150-MN. NOAA/NESDIS, Silver Spring, MD, 4 pp. https://statesummaries.ncics.org/chapter/mn/
Climate at a Glance: Urban Heat Islands. The Heartland Institute. https://climateataglance.com/climate-at-a-glance-urban-heat-islands/
Anthony Watts and James Taylor, ed. H. Sterling Burnett, Climate at a Glance: Temperature-Related Deaths, Heartland Institute, accessed June 10, 2025, https://climateataglance.com/climate-at-a-glance-temperature-related-deaths/.
Runkle, J. et al., Minnesota State Climate Summary 2022. NOAA Technical Report NESDIS 150-MN. NOAA/NESDIS, Silver Spring, MD, 4 pp.
“Intelligence: NICC Annual Reports.” National Interagency Fire Center. Accessed August 1, 2025. https://www.nifc.gov/nicc/predictive-services/intelligence
“Minnesota Tornado History and Statistics.” Minnesota Department of Natural Resources, July 2, 2025. https://www.dnr.state.mn.us/climate/summaries_and_publications/tornadoes.html
“Final Severe Weather Report Database.” NOAA/NWS Storm Prediction Center. Accessed August 6, 2025. https://www.spc.noaa.gov/climo/summary/
U.S. Department of Agriculture. (n.d.). Corn, grain yield data for Minnesota. USDA/NASS QuickStats. https://quickstats.nass.usda.gov/results/BABB0191-E2E0-33B5-A065-56202C6F6916
U.S. Department of Agriculture. (n.d.). Soybean yield data for Minnesota. USDA/NASS QuickStats https://quickstats.nass.usda.gov/results/0811BB83-0A48-392B-962A-F6F6E319D1AF
U.S. Department of Agriculture. (n.d.). Wheat yield data for Minnesota. USDA/NASS QuickStats https://quickstats.nass.usda.gov/results/CF2B6C3E-4525-380F-9A61-ABB9FF14B053
U.S. Department of Agriculture. (n.d.). Sugarbeet yield data for Minnesota. USDA/NASS QuickStats https://quickstats.nass.usda.gov/results/5430C13B-D137-32FA-AC68-AAD906A7D313
We use cookies to ensure that we give you the best experience on our website. If you continue to use this site we will assume that you are happy with it.