Average temperatures in North Dakota have increased very modestly since 1900. During the same period, there has been a significant decline in the frequency of extreme temperatures.
Over the past 30 years, the number of “very hot” days has decreased dramatically. Very hot days now occur only half as often as they did from 1900 to 1990.
There has been no increase in the frequency of very warm nights.
The number of “very cold” days, where temperatures do not rise above zero degrees Fahrenheit, has significantly declined, accounting for much of the modest recent warming.
There has been a slight increase in precipitation, resulting in no increase in drought or wildfires.
Major agricultural crops have seen production increases amid the beneficial warming of recent decades.
Short Summary:
Temperature Trends:
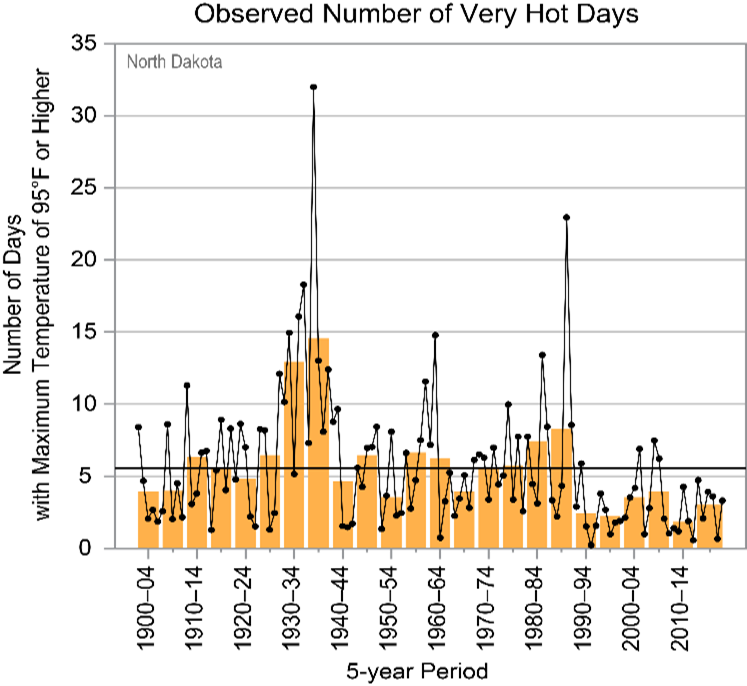
North Dakota’s climate is mostly “continental,” characterized by cold, long winters and short summers. Average temperatures in North Dakota have modestly risen by about 2.6°F since 1900. However, this has not been accompanied by an increase in extreme heat.1 North Dakota’s single-day high temperature record was set on July 6, 1936,2 well before global warming entered the lexicon. In fact, data show the number of very hot (>95°F) days have actually declined since the late 1920s.3 This has resulted in recent decades having the lowest number of 95°F and above days in recorded North Dakota history.
Figure 1: Chart from the 2022 NCEI state climate summary. Observed annual number of very hot days for North Dakota from 1900 to 2020. Dots show annual values, bars show averages over 5-year periods, with the last year being a 6-year average. The horizontal black line shows the long-term average.
The rise in average temperatures is best explained by increases in winter nighttime low temperatures, and a decrease in the number of very cold days. Nighttime temperature measurements are heavily influenced by local heat sources as areas urbanize due to the proliferation of artificial heat sources like concrete, brick, steel, vehicles, air conditioning and heating units, and other machinery associated with developed areas.4
It is important to note that milder winters save lives, as far more people are killed by very cold weather than extreme heat.5
Precipitation:
The eastern portion of North Dakota has more precipitation than the western plains. Overall, the state has seen a gradual increase in annual precipitation since 1900, accompanied by a decline in drought severity. Neither flooding events nor instances of extreme rainfall have increased. The record high single day of precipitation occurred in 1974, the most measured snowfall occurred in 1984, and the deepest snowpack was measured in 1897.6
From 1895 to 2024, drought has not become more frequent or severe.7
State-Specific Issues:
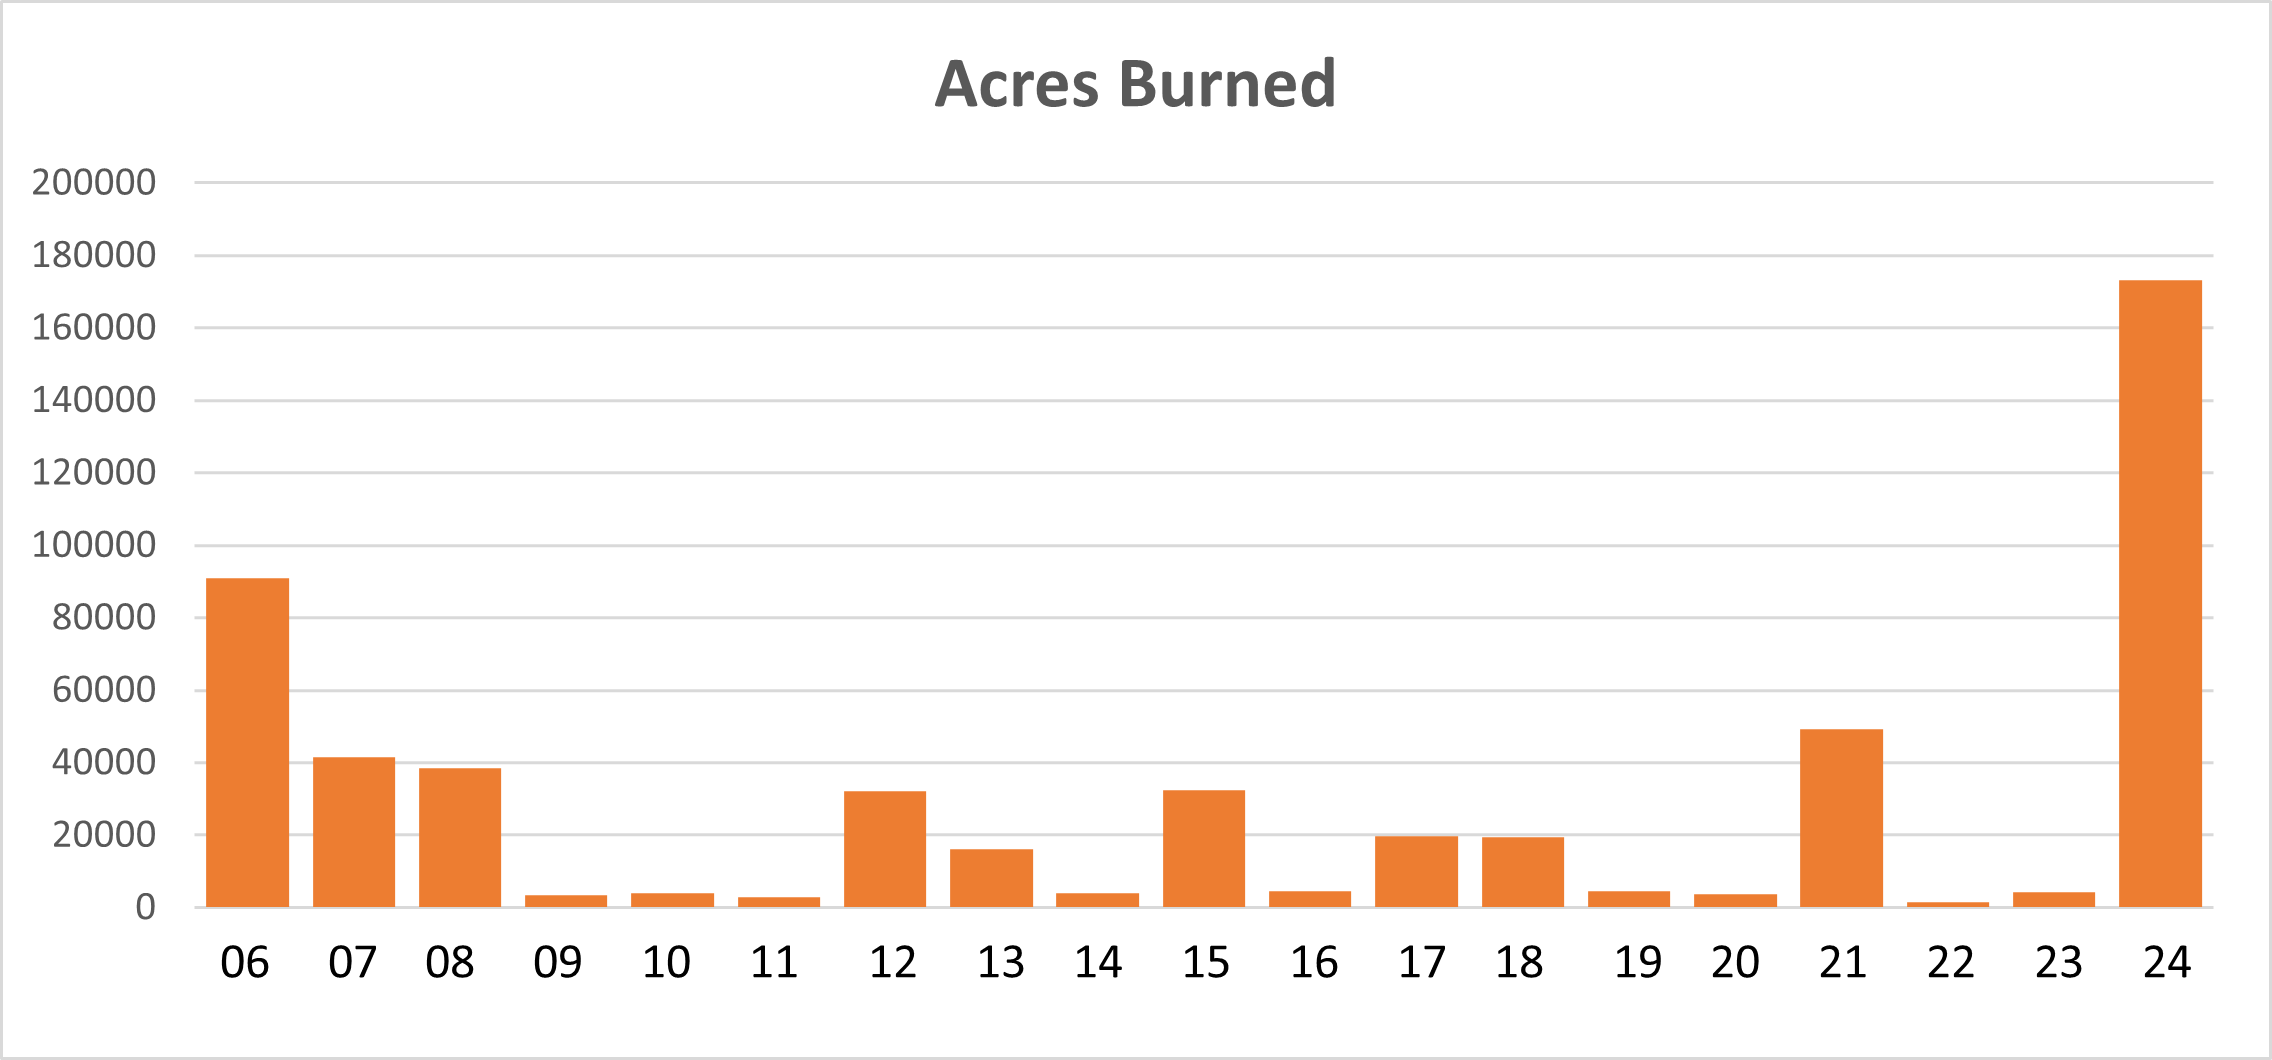
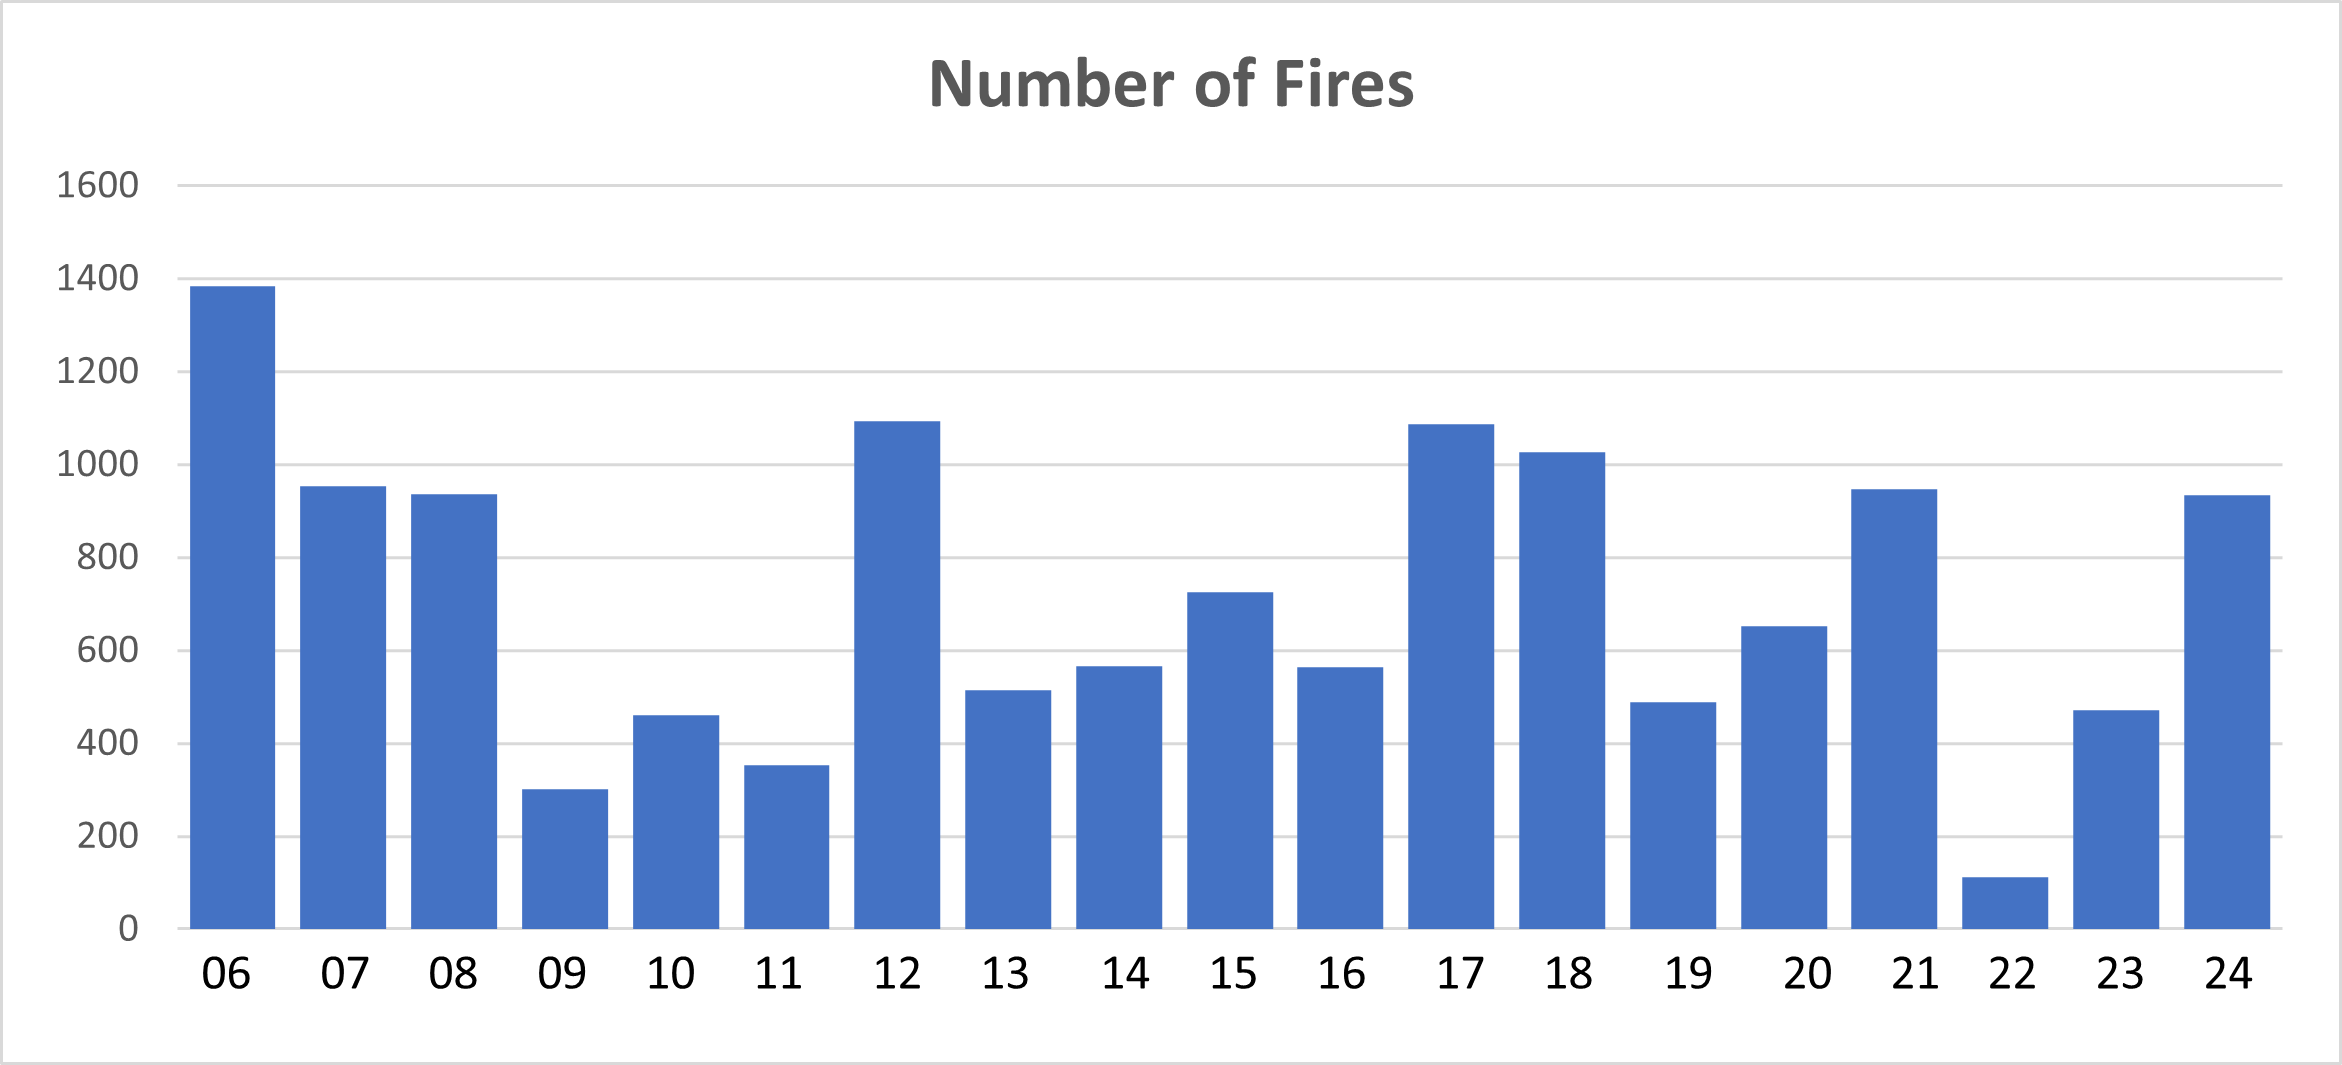
As is the case in many states, wildfires—especially grass fires like the large fires in northwestern parts of the state in October 2024– pose a threat. Aside from the devastating 2024 fires, data show no statistically significant trend in the number of wildfires or acreage burned in North Dakota since the National Interagency Coordination Center began keeping fire records for North Dakota in 2006.8
Figure 2: Total acres burned by wildfire in North Dakota since 2006. Data from National Interagency Fire Center.
Figure 3: Number of wildfires in North Dakota since 2006, data from National Interagency Fire Center.
Agriculture:
North Dakota’s landscape is dominated by vast plains and prairies. Crop production occurs mostly in the eastern portion of the state, while cattle ranching dominates the state’s western lands.
Major crops for North Dakota include spring wheat, sunflowers, canola, and honey.
Spring wheat production grew in the early 1900s, plateaued in the 1990s, and has declined in recent decades.9 However, yields of wheat per acre have continued to increase. This suggests that some farmers have switched to different crops even though conditions for wheat production remain quite favorable. Data suggest government subsidies for crops like corn and soybeans for biofuel production have driven the shift. In North Dakota, USDA statistics show corn production has grown 530 percent since 1997, and soybean production increased by 477 percent.10 Sunflower production has declined, likely for the same reason that wheat has. Meanwhile, canola yields, another significant crop subsidized for biofuel production, have skyrocketed since the 1990s.11
Data indicate that honey production increased 16 percent from 1987, when record keeping began, to 2023, when the last survey was conducted.12
Like its neighbors, North Dakota produces a substantial amount of cattle. Since 1988, cattle production by weight has increased 34 percent according to the USDA.13
In short, there is no evidence whatsoever that climate change has been or will be detrimental to North Dakota’s agricultural or ranching sectors.
References:
Rebekah Frankson and Kenneth E. Kunkel, State Climate Summaries 2022: North Dakota, National Centers for Environmental Information, https://statesummaries.ncics.org/chapter/nd/
Global, regional, and national burden of mortality associated with non-optimal ambient temperatures from 2000 to 2019: a three-stage modelling study, Qi Zhao, et al., The Lancet Planetary Health, July 2021, accessed October 7, 2022, https://doi.org/10.1016/S2542-5196(21)00081-4.
National Oceanic and Atmospheric Administration, “Records: State Climate Extremes Committee.”
Average temperatures in North Dakota have increased very modestly since 1900. During the same period, there has been a significant decline in the frequency of extreme temperatures.
Over the past 30 years, the number of “very hot” days has decreased dramatically. Very hot days now occur only half as often as they did from 1900 to 1990.
There has been no increase in the frequency of very warm nights.
The number of “very cold” days, where temperatures do not rise above zero degrees Fahrenheit, has significantly declined, accounting for much of the modest recent warming.
There has been a slight increase in precipitation, resulting in no increase in drought or wildfires.
Major agricultural crops have seen production increases amid the beneficial warming of recent decades.
Short Summary:
Temperature Trends:
North Dakota’s climate is mostly “continental,” characterized by cold, long winters and short summers. Average temperatures in North Dakota have modestly risen by about 2.6°F since 1900. However, this has not been accompanied by an increase in extreme heat.1 North Dakota’s single-day high temperature record was set on July 6, 1936,2 well before global warming entered the lexicon. In fact, data show the number of very hot (>95°F) days have actually declined since the late 1920s.3 This has resulted in recent decades having the lowest number of 95°F and above days in recorded North Dakota history.
Figure 1: Chart from the 2022 NCEI state climate summary. Observed annual number of very hot days for North Dakota from 1900 to 2020. Dots show annual values, bars show averages over 5-year periods, with the last year being a 6-year average. The horizontal black line shows the long-term average.
The rise in average temperatures is best explained by increases in winter nighttime low temperatures, and a decrease in the number of very cold days. Nighttime temperature measurements are heavily influenced by local heat sources as areas urbanize due to the proliferation of artificial heat sources like concrete, brick, steel, vehicles, air conditioning and heating units, and other machinery associated with developed areas.4
It is important to note that milder winters save lives, as far more people are killed by very cold weather than extreme heat.5
Precipitation:
The eastern portion of North Dakota has more precipitation than the western plains. Overall, the state has seen a gradual increase in annual precipitation since 1900, accompanied by a decline in drought severity. Neither flooding events nor instances of extreme rainfall have increased. The record high single day of precipitation occurred in 1974, the most measured snowfall occurred in 1984, and the deepest snowpack was measured in 1897.6
From 1895 to 2024, drought has not become more frequent or severe.7
State-Specific Issues:
As is the case in many states, wildfires—especially grass fires like the large fires in northwestern parts of the state in October 2024– pose a threat. Aside from the devastating 2024 fires, data show no statistically significant trend in the number of wildfires or acreage burned in North Dakota since the National Interagency Coordination Center began keeping fire records for North Dakota in 2006.8
Figure 2: Total acres burned by wildfire in North Dakota since 2006. Data from National Interagency Fire Center.
Figure 3: Number of wildfires in North Dakota since 2006, data from National Interagency Fire Center.
Agriculture:
North Dakota’s landscape is dominated by vast plains and prairies. Crop production occurs mostly in the eastern portion of the state, while cattle ranching dominates the state’s western lands.
Major crops for North Dakota include spring wheat, sunflowers, canola, and honey.
Spring wheat production grew in the early 1900s, plateaued in the 1990s, and has declined in recent decades.9 However, yields of wheat per acre have continued to increase. This suggests that some farmers have switched to different crops even though conditions for wheat production remain quite favorable. Data suggest government subsidies for crops like corn and soybeans for biofuel production have driven the shift. In North Dakota, USDA statistics show corn production has grown 530 percent since 1997, and soybean production increased by 477 percent.10 Sunflower production has declined, likely for the same reason that wheat has. Meanwhile, canola yields, another significant crop subsidized for biofuel production, have skyrocketed since the 1990s.11
Data indicate that honey production increased 16 percent from 1987, when record keeping began, to 2023, when the last survey was conducted.12
Like its neighbors, North Dakota produces a substantial amount of cattle. Since 1988, cattle production by weight has increased 34 percent according to the USDA.13
In short, there is no evidence whatsoever that climate change has been or will be detrimental to North Dakota’s agricultural or ranching sectors.
References:
Rebekah Frankson and Kenneth E. Kunkel, State Climate Summaries 2022: North Dakota, National Centers for Environmental Information, https://statesummaries.ncics.org/chapter/nd/
Global, regional, and national burden of mortality associated with non-optimal ambient temperatures from 2000 to 2019: a three-stage modelling study, Qi Zhao, et al., The Lancet Planetary Health, July 2021, accessed October 7, 2022, https://doi.org/10.1016/S2542-5196(21)00081-4.
National Oceanic and Atmospheric Administration, “Records: State Climate Extremes Committee.”
We use cookies to ensure that we give you the best experience on our website. If you continue to use this site we will assume that you are happy with it.