Oregon, like other states, has experienced modest temperature increases over the past century.
A slight decline in below-zero nights has resulted in fewer temperature-related deaths.
Precipitation has not changed appreciably.
Oregon’s coast is not threatened by sea level rise, which is modest, with some locations experiencing declining sea levels.
Short Summary:
Temperature Trends:
Like most large states, Oregon contains multiple climate zones, according to Köppen classification.1 The Cascade Mountain range includes humid continental climates at lower elevations, to subarctic at the highest elevations. Portland and other lower regions experience a warm Mediterranean climate, which does not get as cold in winter and is modestly warm and dry in summer. Central Oregon experiences “cold desert” conditions.
Average temperatures in Oregon rose about 2.5°F since 1900, though much of this is likely do to non-greenhouse gas factors such as a growing population and the urban heat island effect.2 Unlike most states, the observed number of days classified as “extremely hot” have been slightly above average since the 1950s, while the number of very cold nights (0°F or lower) have generally declined since the 1990s. The decline in cold nights is a benefit to Oregonians because very cold temperatures produce more deaths than extremely hot temperatures.3
Precipitation:
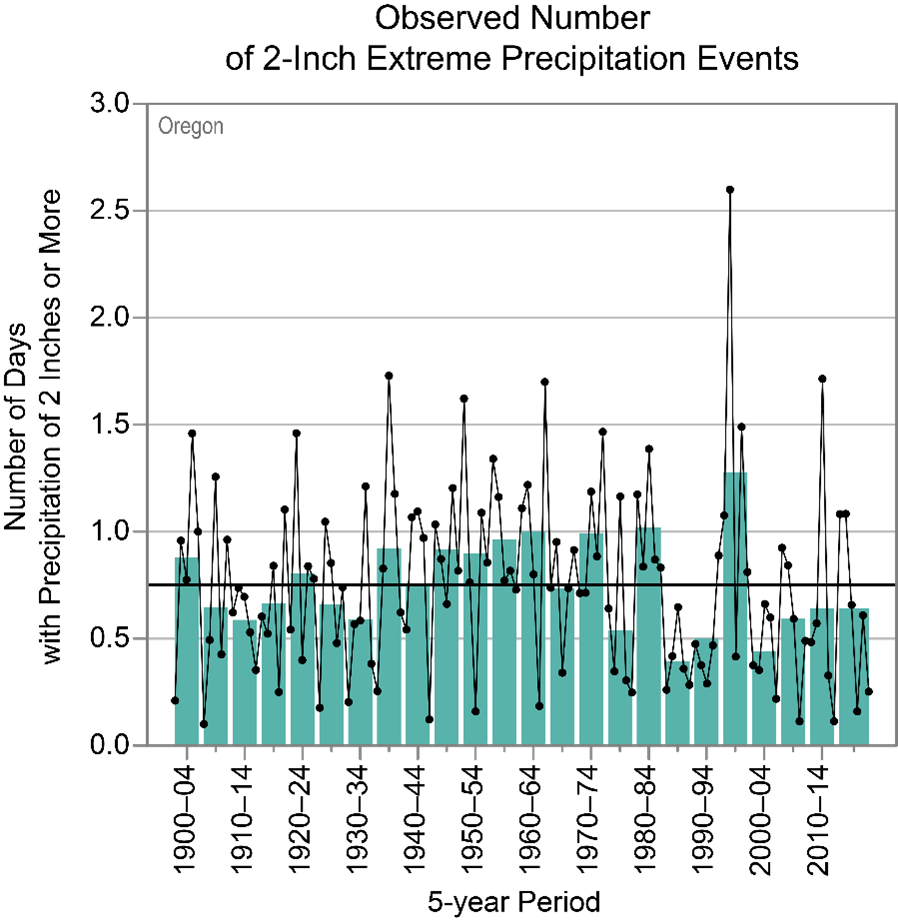
There has been no significant change in annual precipitation in Oregon since 1900. Rainfall amounts in recent decades are similar to those at the beginning of the twentieth century, and 2-inch “extreme” precipitation events have generally declined since the 1970s.4
Figure 1: Chart from the 2022 NCEI state climate summary. Observed annual number of 2-inch extreme precipitation events in Oregon from 1900 to 2020. Dots show annual values, bars show averages over 5-year periods, with the last year being a 6-year average. The horizontal black line shows the long-term average.
Summer drought conditions and rainfall remain close to what Oregon experienced in the early twentieth century, though not as severe as the record lows around that period.5
The state’s weather and overall climate is moderated by the Pacific Ocean, which heavily influences periods of higher and lower precipitation and overall temperature. This is particularly true with regards to the El Niño-Southern Oscillation.6 The spike in precipitation and flooding from the “super” El Niño of 1997-98, for example, can be seen in the chart describing 2-inch extreme precipitation events.
State-Specific Issues:
Wildfires
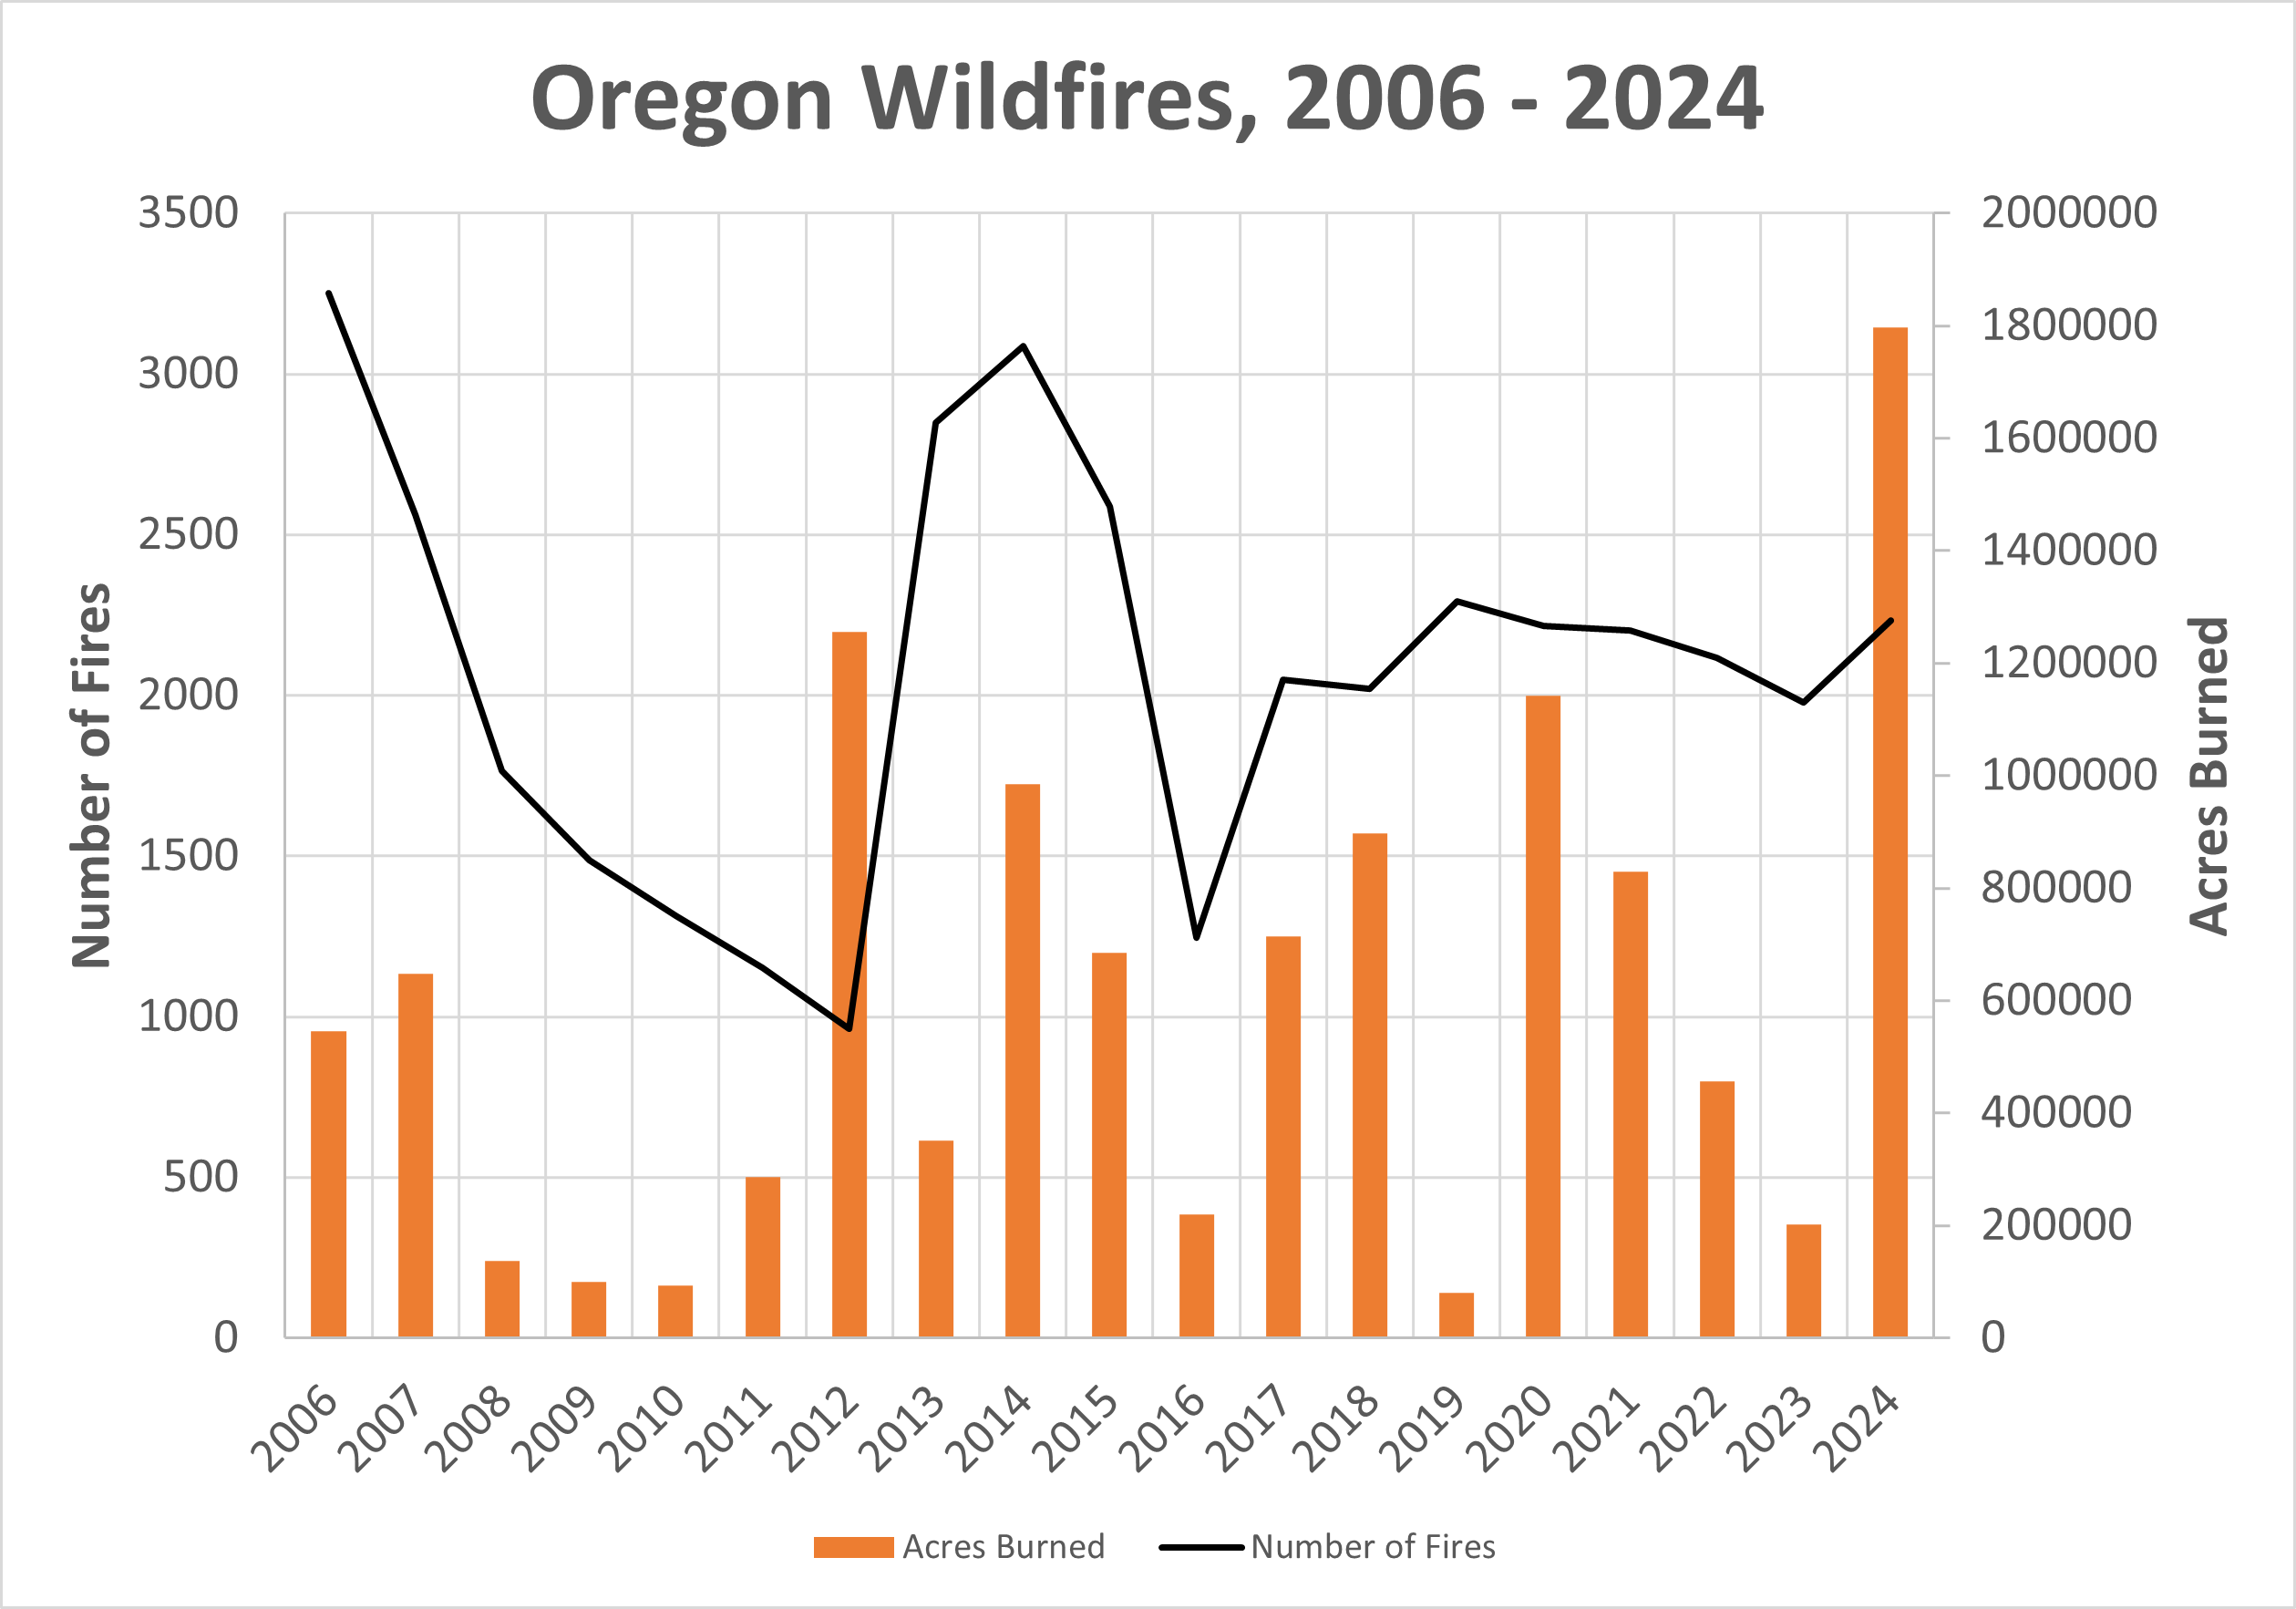
Oregon is prone to wildfires, sometimes very large ones that burn hundreds of thousands of acres. Available wildfire data show no upward trend in either the number of fires or the amount of land burned during the recent period of modest climate change.7
Figure 2: Wildfires in Oregon from 2006 – 2024. Data from the National Interagency Coordination Center.
Sea Level
As a coastal state, sea level rise is a potential concern for Oregon, however, Oregon has some of the lowest rates of relative sea level (RSL) rise in the country. In certain places, like Port Orford and Astoria, RSL is dropping because of local land rising.8 Astoria has seen sea level decline relative to land of -0.14 millimeters per year, which, if continued will result in approximately -0.05 feet decrease in sea level over 100 years at that location. Other stations record a RSL of 1.13 millimeters per year (Charleston) to 2.52 millimeters per year (Garibaldi), the latter equaling about eight-tenths of a foot of rise by 2125.9
Figure 3: Relative Sea Level change over time, displayed as monthly mean sea level. Chart from NOAA Tides and Currents.
Agriculture:
Oregon produces a large variety of agricultural products, with most of the state’s agricultural income coming from greenhouse and nursery production, which is largely shielded from the weather. The state also produces hay and wheat. Uniquely, Oregon is the country’s number one and almost exclusive producer of hazelnuts.
There is limited data available on hazelnut production; 2018 is the earliest year with survey data from the U.S. Department of Agriculture. That data show that from 2018 and the latest production survey date on record, 2022, production rose 30 percent.10 The hazelnut industry has been growing in Oregon quickly since just 2014, with the amount of land devoted to growing hazelnuts more than doubling.11
Since 1909, Oregon has seen an increase in hay yields of 94 percent,12 and wheat saw an astonishing 329 percent improvement in yields over the same period.13
Conclusion:
Despite modest warming over the past hundred-plus years, Oregon has seen little negative effects. Major agricultural products have experienced improved yields over time, the rate of relative sea level change is extremely low, and much of the state’s coastal sea levels are falling relative to land.
R. Frankson, K. E. Kunkel, S. M. Champion, L. E. Stevens, D. R. Easterling, K. Dello, M. Dalton, D. Sharp, and L. O’Neill, Oregon State Climate Summary 2022, NOAA Technical Report NESDIS 150-OR (Silver Spring, MD: NOAA/NESDIS, 2022), https://statesummaries.ncics.org/chapter/or/
Anthony Watts and James Taylor, ed. H. Sterling Burnett, Climate at a Glance: Temperature-Related Deaths, Heartland Institute, accessed June 10, 2025, https://climateataglance.com/climate-at-a-glance-temperature-related-deaths/.
Frankson et al., “Oregon State Climate Summary 2022.”
“Intelligence: NICC Annual Reports.” National Interagency Fire Center. Accessed October 8, 2025. https://www.nifc.gov/nicc/predictive-services/intelligence
Oregon, like other states, has experienced modest temperature increases over the past century.
A slight decline in below-zero nights has resulted in fewer temperature-related deaths.
Precipitation has not changed appreciably.
Oregon’s coast is not threatened by sea level rise, which is modest, with some locations experiencing declining sea levels.
Short Summary:
Temperature Trends:
Like most large states, Oregon contains multiple climate zones, according to Köppen classification.1 The Cascade Mountain range includes humid continental climates at lower elevations, to subarctic at the highest elevations. Portland and other lower regions experience a warm Mediterranean climate, which does not get as cold in winter and is modestly warm and dry in summer. Central Oregon experiences “cold desert” conditions.
Average temperatures in Oregon rose about 2.5°F since 1900, though much of this is likely do to non-greenhouse gas factors such as a growing population and the urban heat island effect.2 Unlike most states, the observed number of days classified as “extremely hot” have been slightly above average since the 1950s, while the number of very cold nights (0°F or lower) have generally declined since the 1990s. The decline in cold nights is a benefit to Oregonians because very cold temperatures produce more deaths than extremely hot temperatures.3
Precipitation:
There has been no significant change in annual precipitation in Oregon since 1900. Rainfall amounts in recent decades are similar to those at the beginning of the twentieth century, and 2-inch “extreme” precipitation events have generally declined since the 1970s.4
Figure 1: Chart from the 2022 NCEI state climate summary. Observed annual number of 2-inch extreme precipitation events in Oregon from 1900 to 2020. Dots show annual values, bars show averages over 5-year periods, with the last year being a 6-year average. The horizontal black line shows the long-term average.
Summer drought conditions and rainfall remain close to what Oregon experienced in the early twentieth century, though not as severe as the record lows around that period.5
The state’s weather and overall climate is moderated by the Pacific Ocean, which heavily influences periods of higher and lower precipitation and overall temperature. This is particularly true with regards to the El Niño-Southern Oscillation.6 The spike in precipitation and flooding from the “super” El Niño of 1997-98, for example, can be seen in the chart describing 2-inch extreme precipitation events.
State-Specific Issues:
Wildfires
Oregon is prone to wildfires, sometimes very large ones that burn hundreds of thousands of acres. Available wildfire data show no upward trend in either the number of fires or the amount of land burned during the recent period of modest climate change.7
Figure 2: Wildfires in Oregon from 2006 – 2024. Data from the National Interagency Coordination Center.
Sea Level
As a coastal state, sea level rise is a potential concern for Oregon, however, Oregon has some of the lowest rates of relative sea level (RSL) rise in the country. In certain places, like Port Orford and Astoria, RSL is dropping because of local land rising.8 Astoria has seen sea level decline relative to land of -0.14 millimeters per year, which, if continued will result in approximately -0.05 feet decrease in sea level over 100 years at that location. Other stations record a RSL of 1.13 millimeters per year (Charleston) to 2.52 millimeters per year (Garibaldi), the latter equaling about eight-tenths of a foot of rise by 2125.9
Figure 3: Relative Sea Level change over time, displayed as monthly mean sea level. Chart from NOAA Tides and Currents.
Agriculture:
Oregon produces a large variety of agricultural products, with most of the state’s agricultural income coming from greenhouse and nursery production, which is largely shielded from the weather. The state also produces hay and wheat. Uniquely, Oregon is the country’s number one and almost exclusive producer of hazelnuts.
There is limited data available on hazelnut production; 2018 is the earliest year with survey data from the U.S. Department of Agriculture. That data show that from 2018 and the latest production survey date on record, 2022, production rose 30 percent.10 The hazelnut industry has been growing in Oregon quickly since just 2014, with the amount of land devoted to growing hazelnuts more than doubling.11
Since 1909, Oregon has seen an increase in hay yields of 94 percent,12 and wheat saw an astonishing 329 percent improvement in yields over the same period.13
Conclusion:
Despite modest warming over the past hundred-plus years, Oregon has seen little negative effects. Major agricultural products have experienced improved yields over time, the rate of relative sea level change is extremely low, and much of the state’s coastal sea levels are falling relative to land.
R. Frankson, K. E. Kunkel, S. M. Champion, L. E. Stevens, D. R. Easterling, K. Dello, M. Dalton, D. Sharp, and L. O’Neill, Oregon State Climate Summary 2022, NOAA Technical Report NESDIS 150-OR (Silver Spring, MD: NOAA/NESDIS, 2022), https://statesummaries.ncics.org/chapter/or/
Anthony Watts and James Taylor, ed. H. Sterling Burnett, Climate at a Glance: Temperature-Related Deaths, Heartland Institute, accessed June 10, 2025, https://climateataglance.com/climate-at-a-glance-temperature-related-deaths/.
Frankson et al., “Oregon State Climate Summary 2022.”
“Intelligence: NICC Annual Reports.” National Interagency Fire Center. Accessed October 8, 2025. https://www.nifc.gov/nicc/predictive-services/intelligence
We use cookies to ensure that we give you the best experience on our website. If you continue to use this site we will assume that you are happy with it.