South Carolina has experienced approximately 1°F warming since 1900; the modest warming has not been accompanied by an increase in heatwaves.
There is no long-term trend in either heavy rain or drought.
South Carolina’s sea level rise has largely been driven by land subsidence, which can be managed through civil engineering solutions.
Hurricanes have not become more frequent or severe.
Major crops like peaches, cotton, and peanuts have experienced increasing yields.
Short Summary:
Temperature Trends:
South Carolina is dominated by a humid, subtropical climate. Winters tend to be fairly mild with temperatures rarely dropping below freezing for sustained periods of time. Summers tend to be hot. South Carolina experiences significant precipitation year-round.1
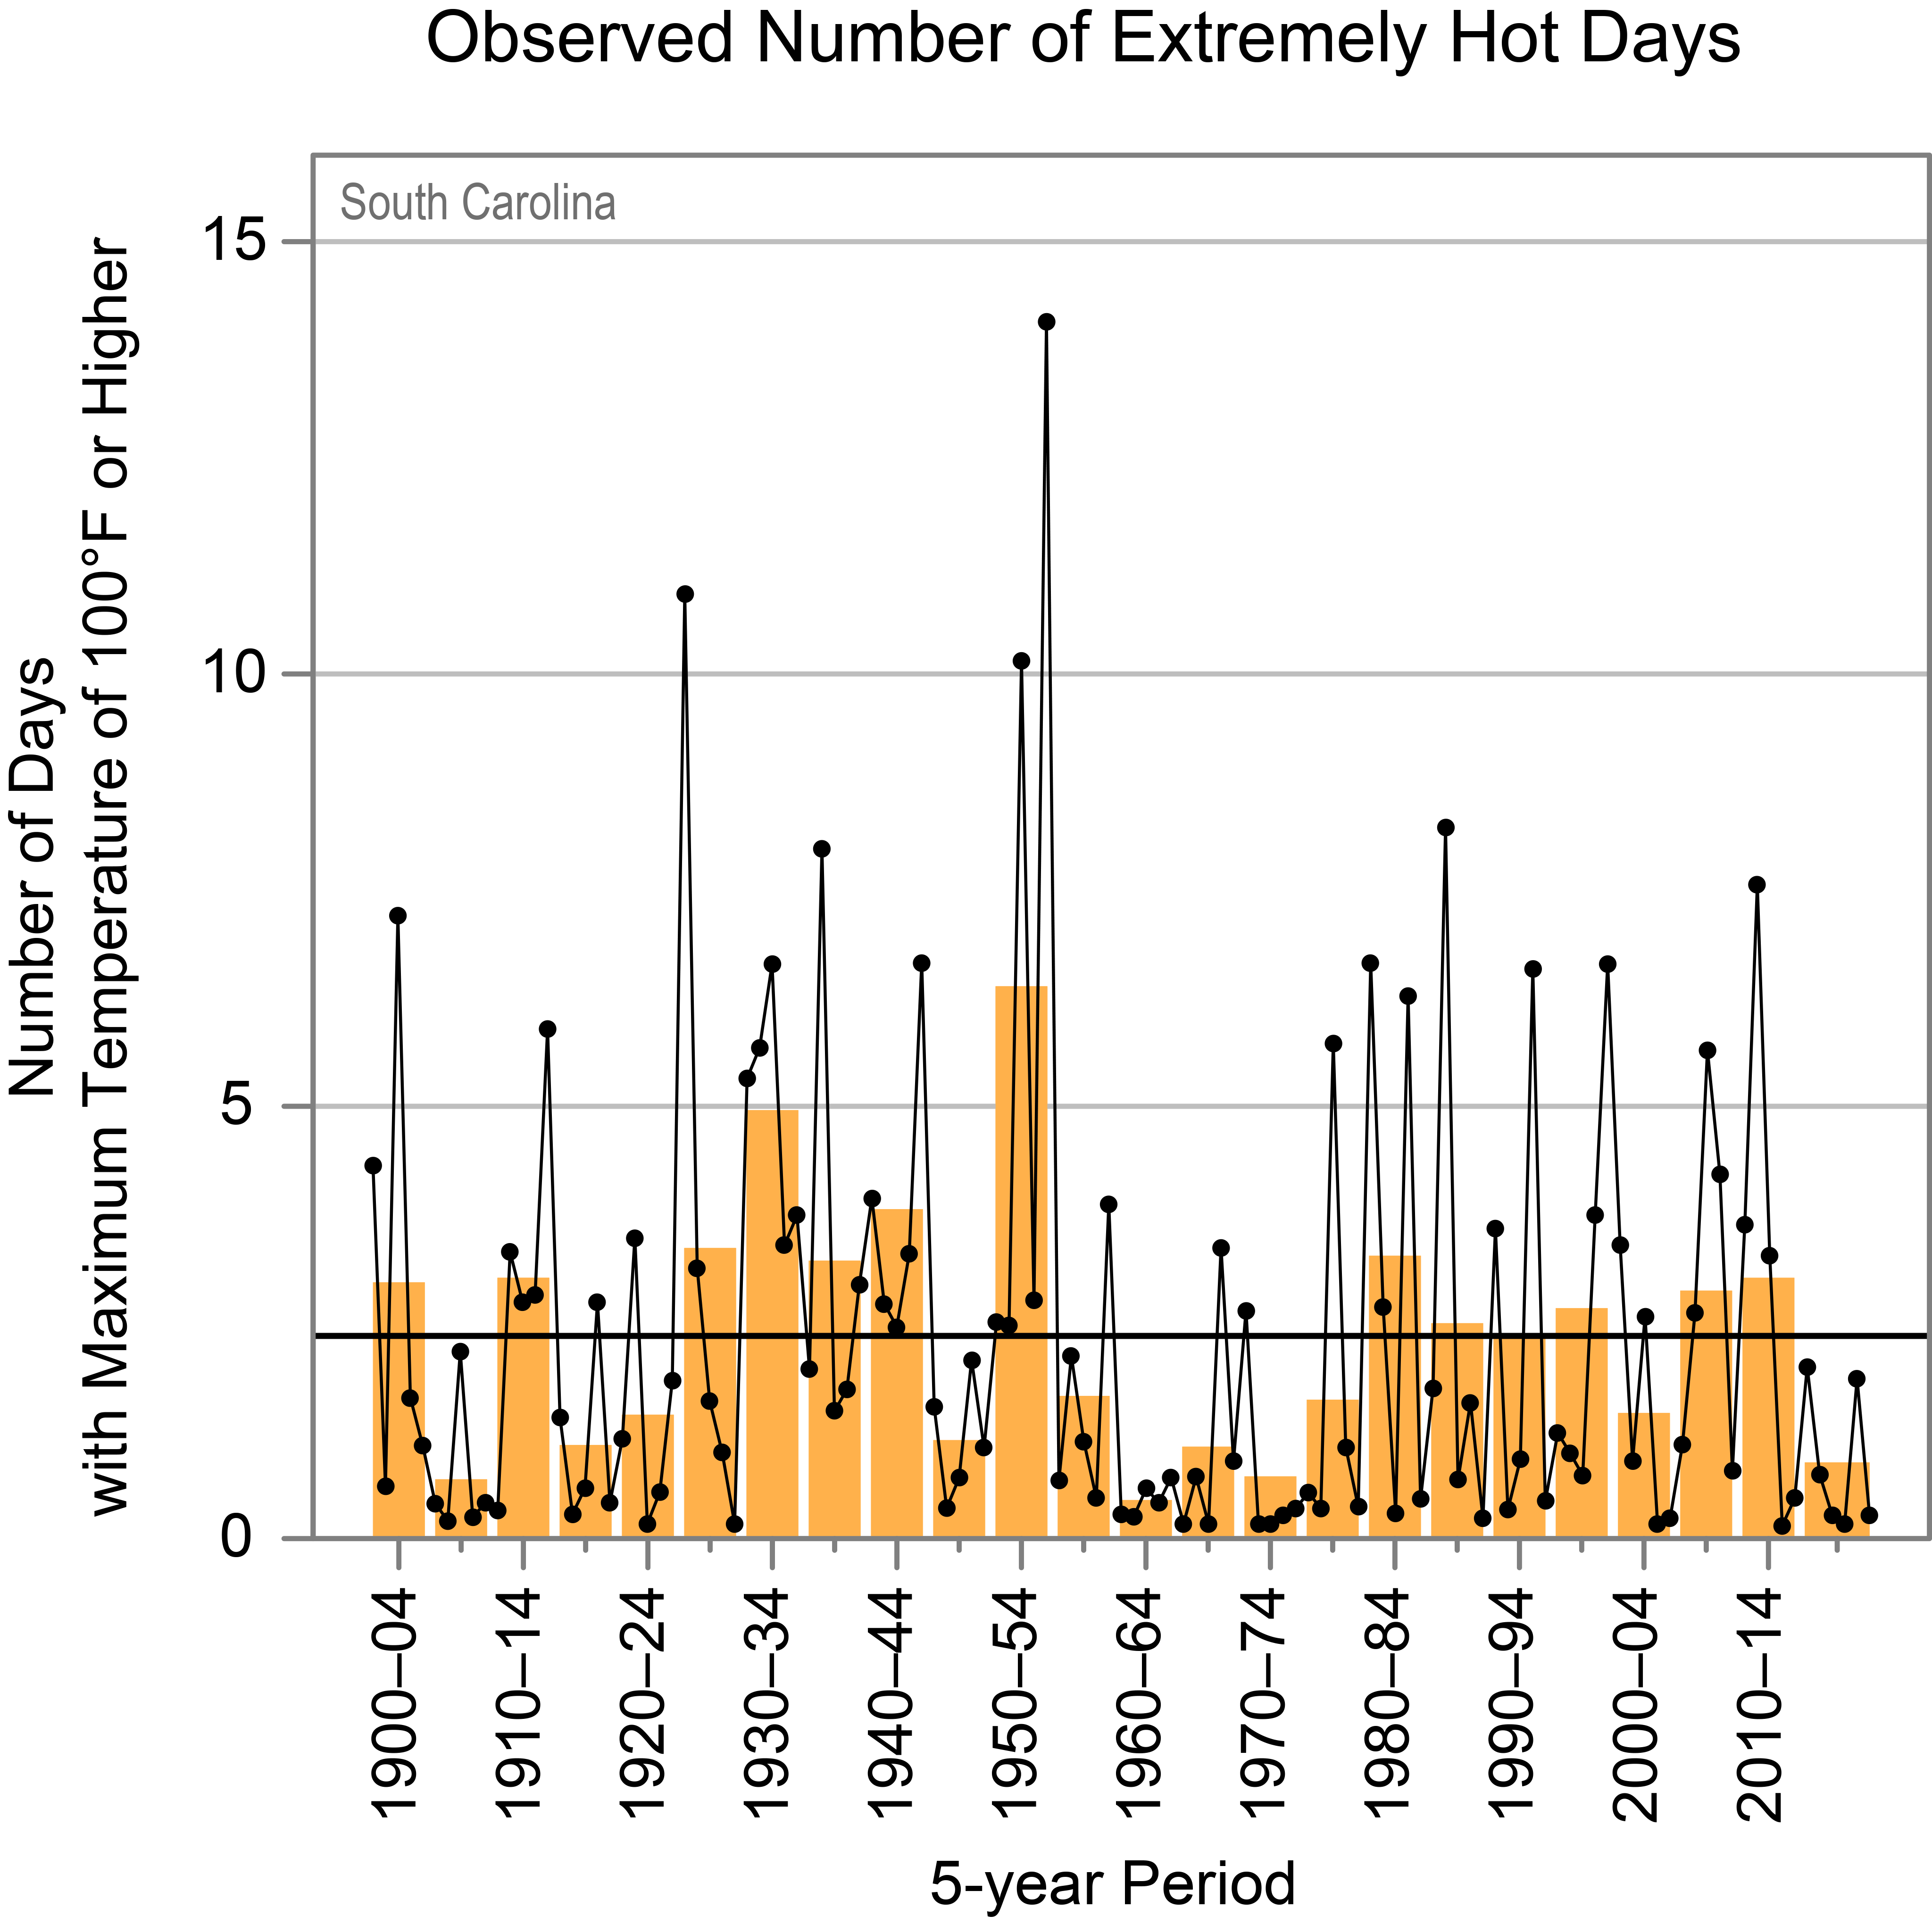
Average temperatures have increased by just over 1°F since 1900. That rise was not accompanied by any increase in the number of “extremely hot days,” which the National Oceanic and Atmospheric Administration (NOAA) defines as days with maximum temperatures over 100°F.2 There have been significantly fewer extremely hot days in recent decades compared to the 1930s through the 1950s.
Figure 1: Observed number of very hot days in South Carolina since 1900. Dots are annual values. Orange bars show averages over a 5-year period, the last bar is a 6-year average. The horizontal black line shows the average of the entire period. Chart from Frankson, R., K.E. Kunkel, S.M. Champion, and D.R. Easterling, 2022: Ohio State Climate Summary 2022.
The rise in average temperatures is most likely due to a slight decline in the number of winter days below freezing since the 1980s, and an increase in the number of nights with temperatures of 75°F or warmer.3 The gradual increase in nighttime highs, but not daytime highs, suggests something other than greenhouse gases are driving the modest air temperature increases. The most likely culprit is an increase in the Urban Heat Island (UHI) effect influencing temperature readings at measurement stations. Sunlight during the daytime heats up solid surfaces like concrete, asphalt, and metal, which all hold heat longer than natural environments. Then, at night, the heat is gradually released, increasing local temperature.
South Carolina is the state with the fastest growing population in the country, primarily in coastal areas,4 and research shows that population growth is closely tied to an increase in the UHI, with it potentially being responsible for up to 65 percent of observed warming in urban and suburban areas.5
Precipitation:
There is no long-term trend of increasing or decreasing annual precipitation across South Carolina.6 Nor has drought become more frequent or severe. Significant droughts in the 2010s and late 1990s were both preceded and followed by years of very minimal drought, again with no sustained pattern or long-term trend.7
State-Specific Issues:
Sea Level Rise and Flooding
South Carolina has a 187-mile-long coastline, with thousands of miles of tidal waters, winding coastal saltwater creeks, and estuaries within that distance. A persistent concern for coastal communities is erosion from the tides and waves.
There are two major official tide gauge measurement sites in South Carolina, at Charleston and Springmaid Pier. The relative sea level trend for Charleston is 3.51mm/year, and 3.36mm/year at Springmaid Pier.8 They average to slightly more than a foot of rise per century. This rate of rise is lower than the Earth’s average annual rate of increase and, at the low end of historic norms.
Relative sea level rise, however, does not merely measure the absolute increase in water levels due to an increase in water itself, but also includes the sinking of the land, or subsidence, which is a major known issue in the rapidly developing South Carolina coastal regions. Charleston, for instance, was once mostly swampy salt marsh, which was purposely filled in so that more infrastructure could be built there.9 Groundwater withdrawals also cause land sinkage. Because of this, during periods of high tides, Charleston suffers a large amount of flooding, which has gotten worse over time as population and development have increased in a city with poor water management, increasing groundwater withdrawals, and is built on easily compacted soil.
Hurricanes
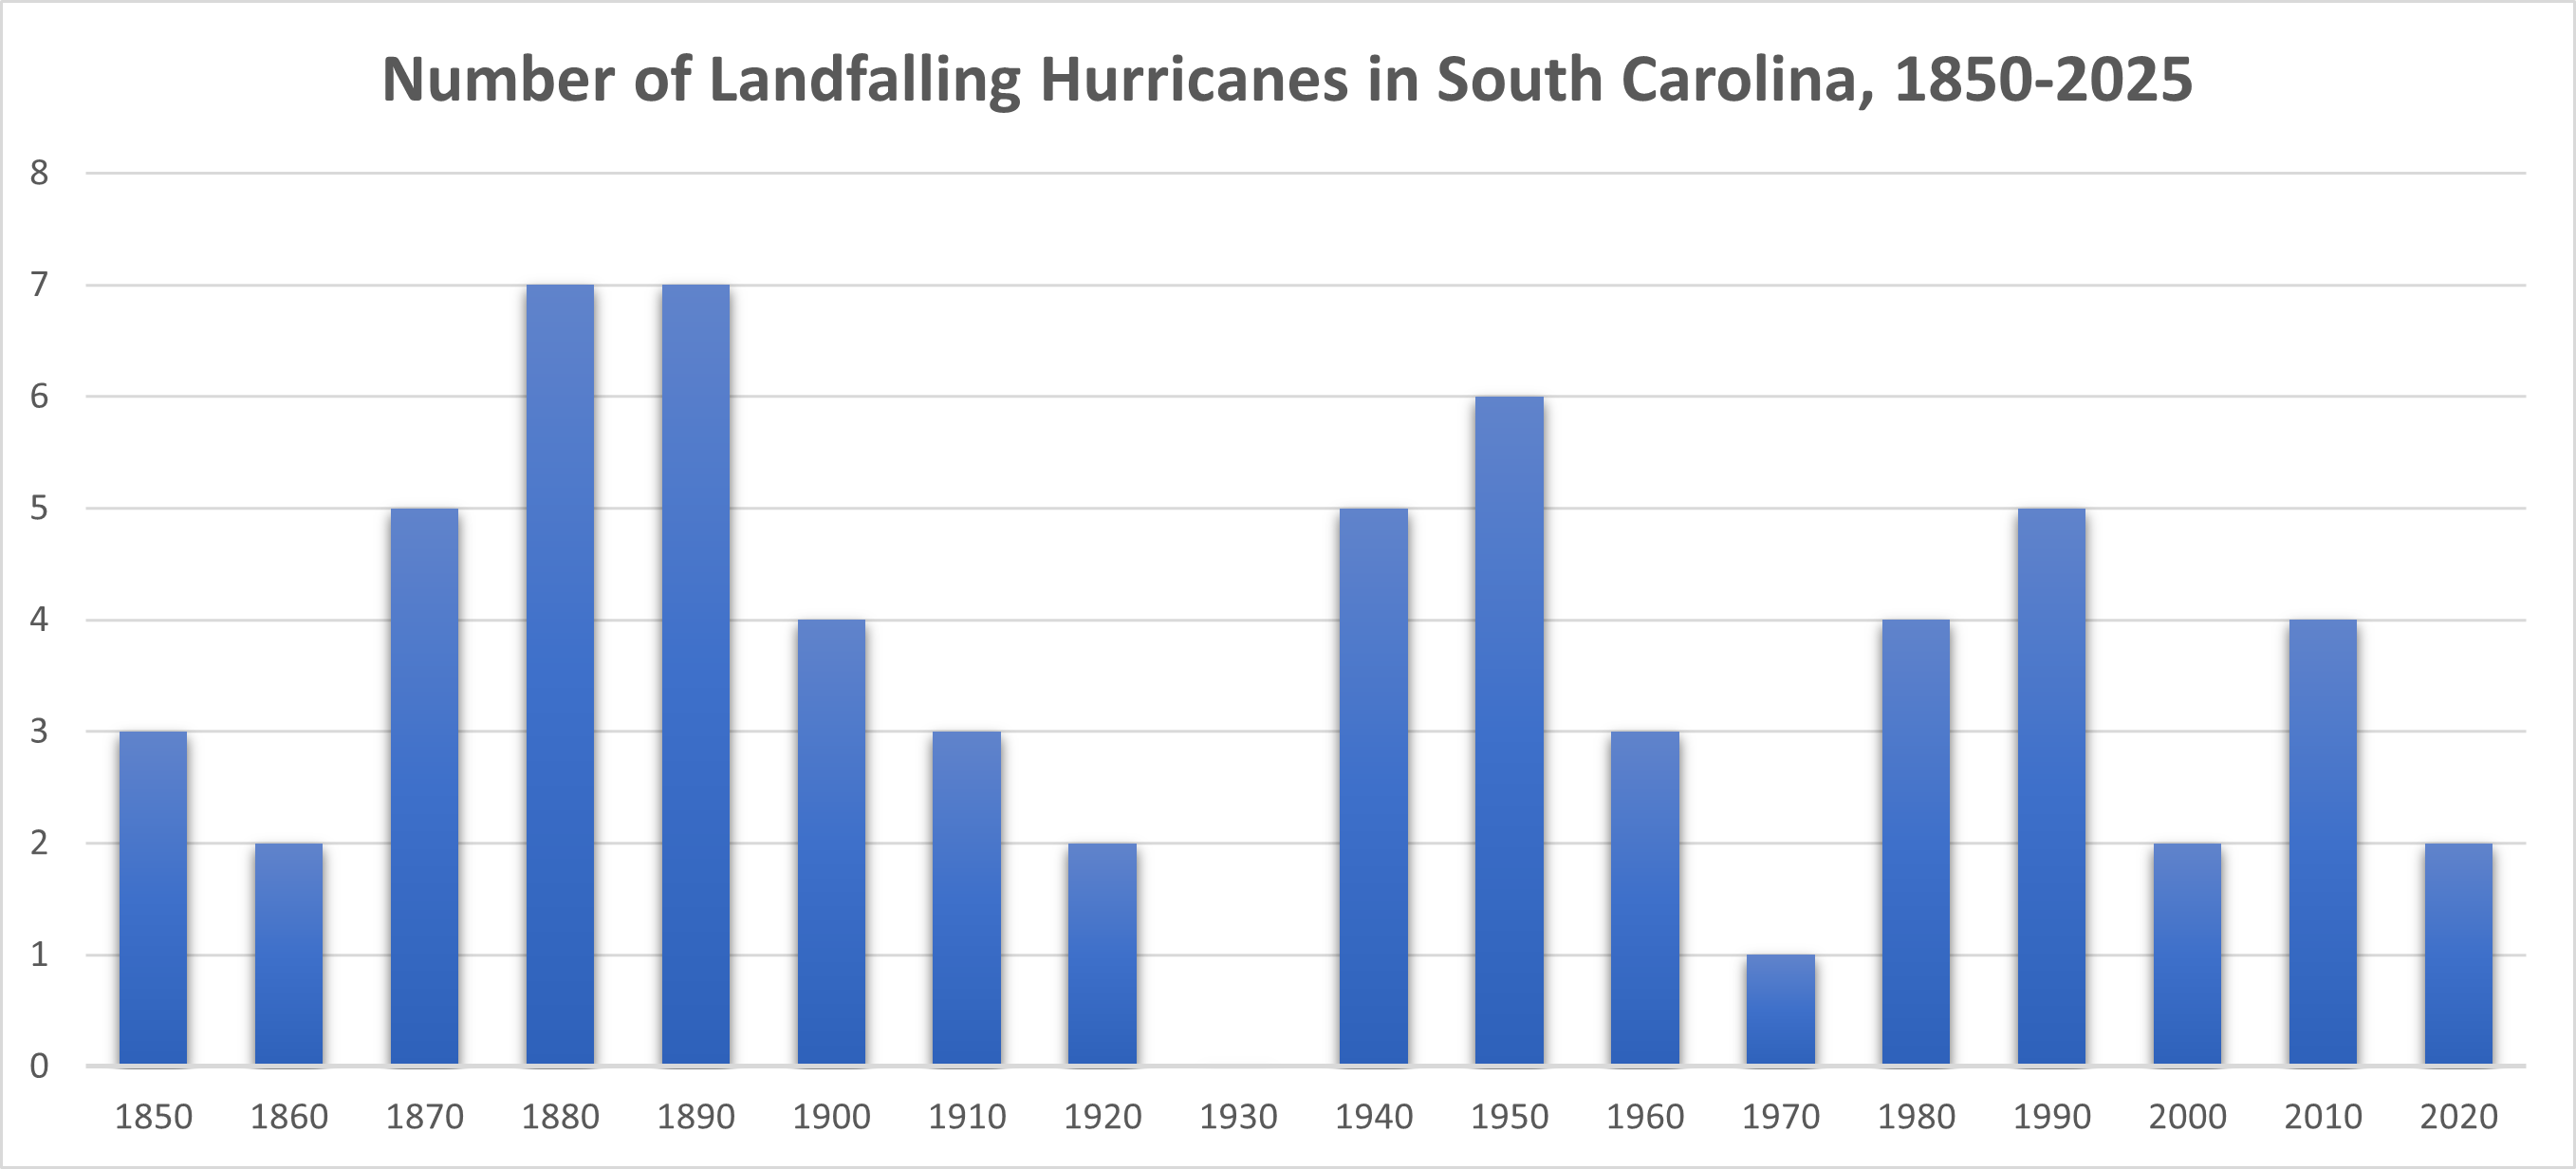
As a coastal state, South Carolina occasionally suffers tropical storm strikes. Globally, there has been no trend in the severity or frequency in tropical storms or major hurricanes.10 The same holds true for South Carolina. There is no increasing trend in storms that make landfall in the state as hurricanes,11 and certainly no increase in landfalling major hurricanes.12
Figure 2: Count of landfalling hurricanes in South Carolina from 1850-2025. Data from NOAA Historical Hurricane Tracks HURDAT 2 database at https://www.climate.gov/maps-data/dataset/historical-hurricane-tracks-gis-map-viewer .
Agriculture:
Some of the major and iconic crops for South Carolina are peaches, cotton, and peanuts.
Peach production and yield data from the United States Department of Agriculture only goes back to 2007, and year-to-year fluctuations are large. In general, peach production has increased by 580 percent from 2007 to 2025.13
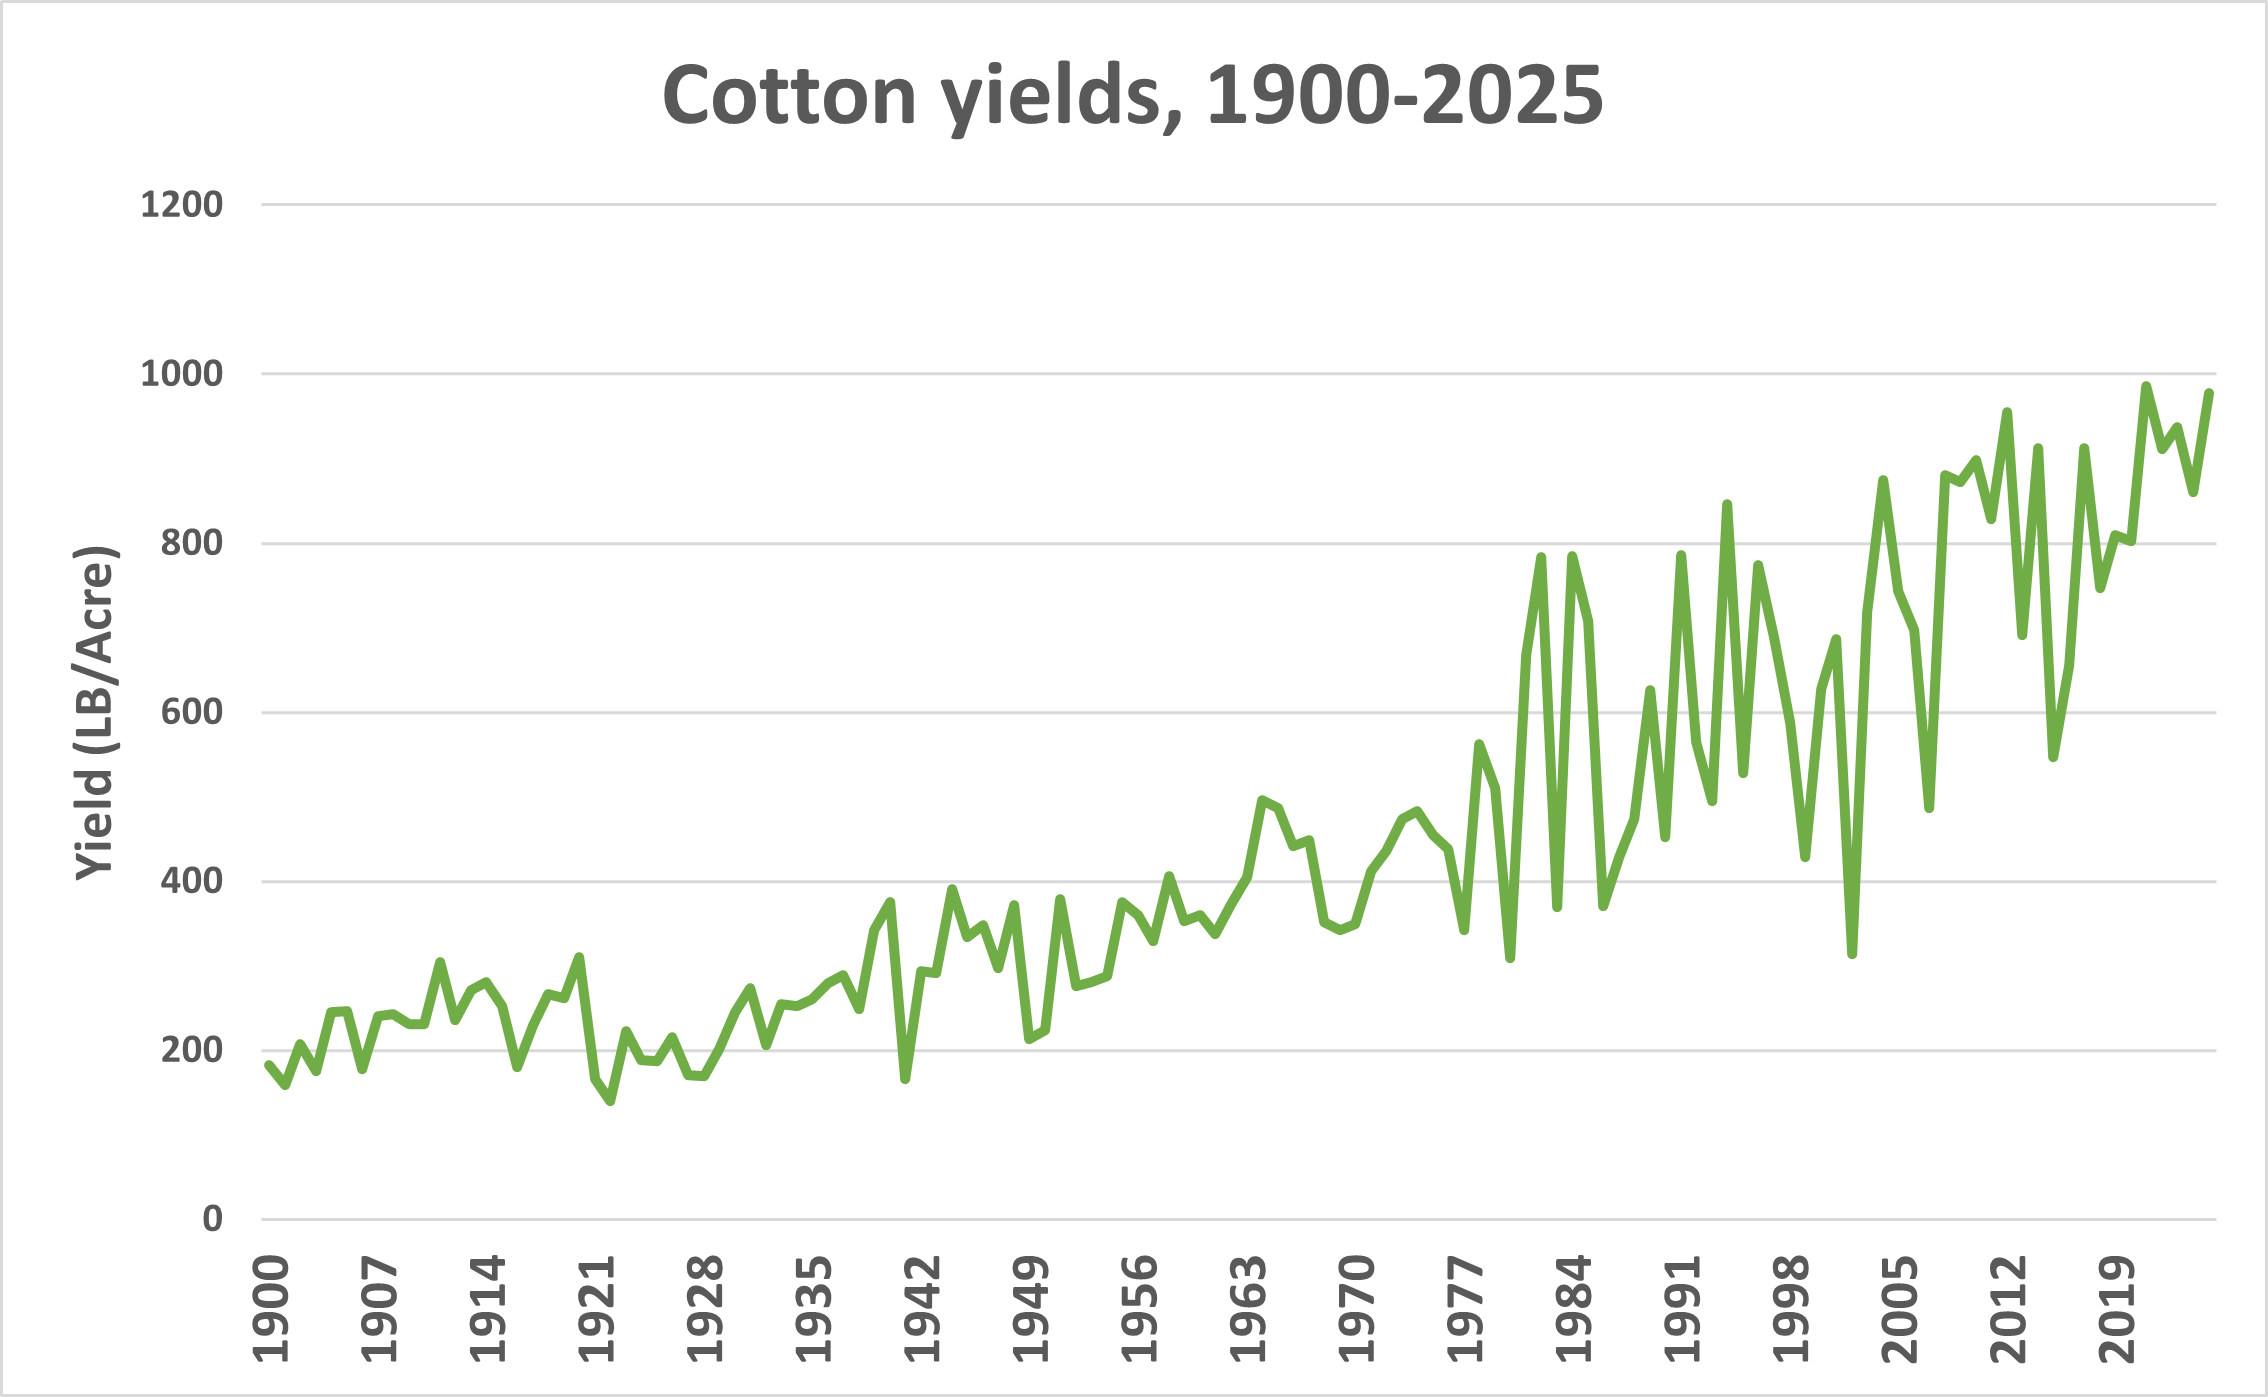
Data for cotton goes back much further, and cotton production saw its height in the 1910s and declined since then partially due to globalization. Nevertheless, since 1900, cotton yields in South Carolina have increased 448 percent.14
Figure 3: Cotton yields in South Carolina since 1900, measured in pounds per acre. Data from USDA QuickStats.
Peanuts have done exceptionally well, with production skyrocketing 7,100 percent since recordkeeping begins in 1909, a 396 percent increase in yields per acre.
Conclusion:
Like every state, South Carolina has unique environmental challenges. However, the evidence suggest it is not particularly threatened by or has experienced much impact from recent climate change. Average temperature has modestly risen since 1900, but that has not resulted in any increase in extreme heat, precipitation, extreme weather, or harm to agriculture. On the latter point, this is likely boosted by carbon dioxide (CO2) fertilization amid rising atmospheric CO2. Agricultural production of historically and culturally important crops to the state has improved substantially, with no sign of climate-related decline.
Frankson, R., K. E. Kunkel, S. M. Champion, and D. R. Easterling, “South Carolina State Climate Summary 2022,” NOAA Technical Report NESDIS 150-OH. Silver Spring, MD: NOAA/NESDIS, https://statesummaries.ncics.org/chapter/oh/
Spencer, Roy W., John R. Christy, and William D. Braswell, “Urban Heat Island Effects in U.S. Summer Surface Temperature Data, 1895–2023,” Journal of Applied Meteorology and Climatology, Department of Interior, https://doi.org/10.1175/JAMC-D-23-0199.1
Frankson, R., et al. 2022, “South Carolina State Climate Summary 2022”
“Tropical Cyclone History for Southeast South Carolina and Northern Portions of Southeast Georgia,” National Weather Service, February 15, 2025, https://www.weather.gov/chs/TChistory
South Carolina has experienced approximately 1°F warming since 1900; the modest warming has not been accompanied by an increase in heatwaves.
There is no long-term trend in either heavy rain or drought.
South Carolina’s sea level rise has largely been driven by land subsidence, which can be managed through civil engineering solutions.
Hurricanes have not become more frequent or severe.
Major crops like peaches, cotton, and peanuts have experienced increasing yields.
Short Summary:
Temperature Trends:
South Carolina is dominated by a humid, subtropical climate. Winters tend to be fairly mild with temperatures rarely dropping below freezing for sustained periods of time. Summers tend to be hot. South Carolina experiences significant precipitation year-round.1
Average temperatures have increased by just over 1°F since 1900. That rise was not accompanied by any increase in the number of “extremely hot days,” which the National Oceanic and Atmospheric Administration (NOAA) defines as days with maximum temperatures over 100°F.2 There have been significantly fewer extremely hot days in recent decades compared to the 1930s through the 1950s.
Figure 1: Observed number of very hot days in South Carolina since 1900. Dots are annual values. Orange bars show averages over a 5-year period, the last bar is a 6-year average. The horizontal black line shows the average of the entire period. Chart from Frankson, R., K.E. Kunkel, S.M. Champion, and D.R. Easterling, 2022: Ohio State Climate Summary 2022.
The rise in average temperatures is most likely due to a slight decline in the number of winter days below freezing since the 1980s, and an increase in the number of nights with temperatures of 75°F or warmer.3 The gradual increase in nighttime highs, but not daytime highs, suggests something other than greenhouse gases are driving the modest air temperature increases. The most likely culprit is an increase in the Urban Heat Island (UHI) effect influencing temperature readings at measurement stations. Sunlight during the daytime heats up solid surfaces like concrete, asphalt, and metal, which all hold heat longer than natural environments. Then, at night, the heat is gradually released, increasing local temperature.
South Carolina is the state with the fastest growing population in the country, primarily in coastal areas,4 and research shows that population growth is closely tied to an increase in the UHI, with it potentially being responsible for up to 65 percent of observed warming in urban and suburban areas.5
Precipitation:
There is no long-term trend of increasing or decreasing annual precipitation across South Carolina.6 Nor has drought become more frequent or severe. Significant droughts in the 2010s and late 1990s were both preceded and followed by years of very minimal drought, again with no sustained pattern or long-term trend.7
State-Specific Issues:
Sea Level Rise and Flooding
South Carolina has a 187-mile-long coastline, with thousands of miles of tidal waters, winding coastal saltwater creeks, and estuaries within that distance. A persistent concern for coastal communities is erosion from the tides and waves.
There are two major official tide gauge measurement sites in South Carolina, at Charleston and Springmaid Pier. The relative sea level trend for Charleston is 3.51mm/year, and 3.36mm/year at Springmaid Pier.8 They average to slightly more than a foot of rise per century. This rate of rise is lower than the Earth’s average annual rate of increase and, at the low end of historic norms.
Relative sea level rise, however, does not merely measure the absolute increase in water levels due to an increase in water itself, but also includes the sinking of the land, or subsidence, which is a major known issue in the rapidly developing South Carolina coastal regions. Charleston, for instance, was once mostly swampy salt marsh, which was purposely filled in so that more infrastructure could be built there.9 Groundwater withdrawals also cause land sinkage. Because of this, during periods of high tides, Charleston suffers a large amount of flooding, which has gotten worse over time as population and development have increased in a city with poor water management, increasing groundwater withdrawals, and is built on easily compacted soil.
Hurricanes
As a coastal state, South Carolina occasionally suffers tropical storm strikes. Globally, there has been no trend in the severity or frequency in tropical storms or major hurricanes.10 The same holds true for South Carolina. There is no increasing trend in storms that make landfall in the state as hurricanes,11 and certainly no increase in landfalling major hurricanes.12
Figure 2: Count of landfalling hurricanes in South Carolina from 1850-2025. Data from NOAA Historical Hurricane Tracks HURDAT 2 database at https://www.climate.gov/maps-data/dataset/historical-hurricane-tracks-gis-map-viewer .
Agriculture:
Some of the major and iconic crops for South Carolina are peaches, cotton, and peanuts.
Peach production and yield data from the United States Department of Agriculture only goes back to 2007, and year-to-year fluctuations are large. In general, peach production has increased by 580 percent from 2007 to 2025.13
Data for cotton goes back much further, and cotton production saw its height in the 1910s and declined since then partially due to globalization. Nevertheless, since 1900, cotton yields in South Carolina have increased 448 percent.14
Figure 3: Cotton yields in South Carolina since 1900, measured in pounds per acre. Data from USDA QuickStats.
Peanuts have done exceptionally well, with production skyrocketing 7,100 percent since recordkeeping begins in 1909, a 396 percent increase in yields per acre.
Conclusion:
Like every state, South Carolina has unique environmental challenges. However, the evidence suggest it is not particularly threatened by or has experienced much impact from recent climate change. Average temperature has modestly risen since 1900, but that has not resulted in any increase in extreme heat, precipitation, extreme weather, or harm to agriculture. On the latter point, this is likely boosted by carbon dioxide (CO2) fertilization amid rising atmospheric CO2. Agricultural production of historically and culturally important crops to the state has improved substantially, with no sign of climate-related decline.
Frankson, R., K. E. Kunkel, S. M. Champion, and D. R. Easterling, “South Carolina State Climate Summary 2022,” NOAA Technical Report NESDIS 150-OH. Silver Spring, MD: NOAA/NESDIS, https://statesummaries.ncics.org/chapter/oh/
Spencer, Roy W., John R. Christy, and William D. Braswell, “Urban Heat Island Effects in U.S. Summer Surface Temperature Data, 1895–2023,” Journal of Applied Meteorology and Climatology, Department of Interior, https://doi.org/10.1175/JAMC-D-23-0199.1
Frankson, R., et al. 2022, “South Carolina State Climate Summary 2022”
“Tropical Cyclone History for Southeast South Carolina and Northern Portions of Southeast Georgia,” National Weather Service, February 15, 2025, https://www.weather.gov/chs/TChistory
We use cookies to ensure that we give you the best experience on our website. If you continue to use this site we will assume that you are happy with it.