Since 1900, much of the rise in average temperatures in Utah is attributable to the urban heat island effect.
Precipitation rates have not significantly changed over the past century and drought has recently been lower than the historical norm.
Wildfires have not become more common or extreme.
Production and yields of Utah’s significant agricultural products have increased or remained steady in recent decades.
Short Summary:
Temperature trends:
Average temperatures in Utah have risen 2.5°F since 1900, likely driven more by urbanization at temperature station sites rather than climate change.1,2 In fact, Utah’s single day high temperature record was set in 1985, 40 years ago.
The number of nights with max temperatures measuring 75°F have increased, and the number of “very cold” nights (lows below 0°F) have decreased. These, also, are best explained by the effects of urbanization and the resulting urban heat island effect.
The highest temperature increases in the state have been measured in fast-growing cities like Salt Lake City, where the increase in artificial sources of heat retention and heat generation creates artificial localized warming that skews the average temperature for the state upward. These heat-retention and heat-generation sources typically take the form of more concrete, brick, steel, vehicles, air conditioning, heating units, and other machinery. 3
Of note, data show that Utah’s less extreme winter nights are saving lives.4
Precipitation:
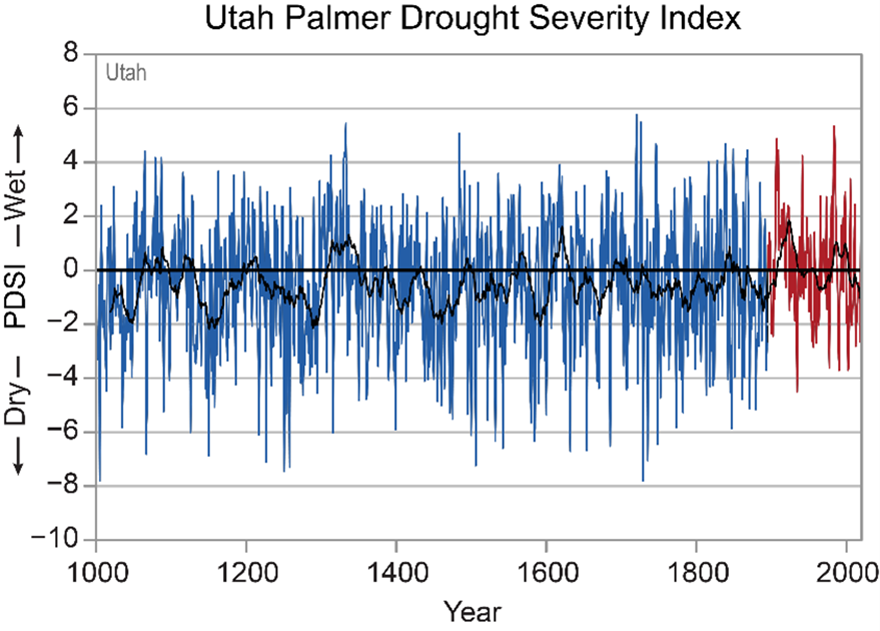
As a state with a predominantly arid climate, Utah’s historical precipitation rates are low. Since 1900, overall annual precipitation has remained stable and extreme precipitation events, like those that contribute to flooding, have declined.5 Long term drought trends have also shifted downward in recent decades.
Figure 1: Chart from the NCEI Utah State Climate Summary for 2022. Values for 1895–2020 in red are based on direct measurements. Values in blue are estimated from indirect measures such as tree rings. The” fluctuating” black line is a running 20-year average. Each bar line represents a given year. The more the line extends downward, the more drought there was in that given year. Drought has clearly become less severe in Utah in recent decades.
State-Specific Issues:
Related to precipitation, alarm has been raised about decreasing water levels in the Great Salt Lake (GSL). However, because drought has not increased and rainfall patterns have been mostly constant, so-called climate change can’t be the source of the decline.
Instead, water withdrawals from the rivers and streams that feed the GSL have increased as the population has grown primarily due to increased agricultural, industrial, and residential use. In recent years, Utah has been among the fastest growing states in the country, having increased its population by approximately 22 percent.6 From 2008 to 2023, Utah’s growth rate was more than triple the national average. Unsurprisingly, this rapid and vast population increase has resulted in a decline in water levels of 11 feet since the late 1800s.7
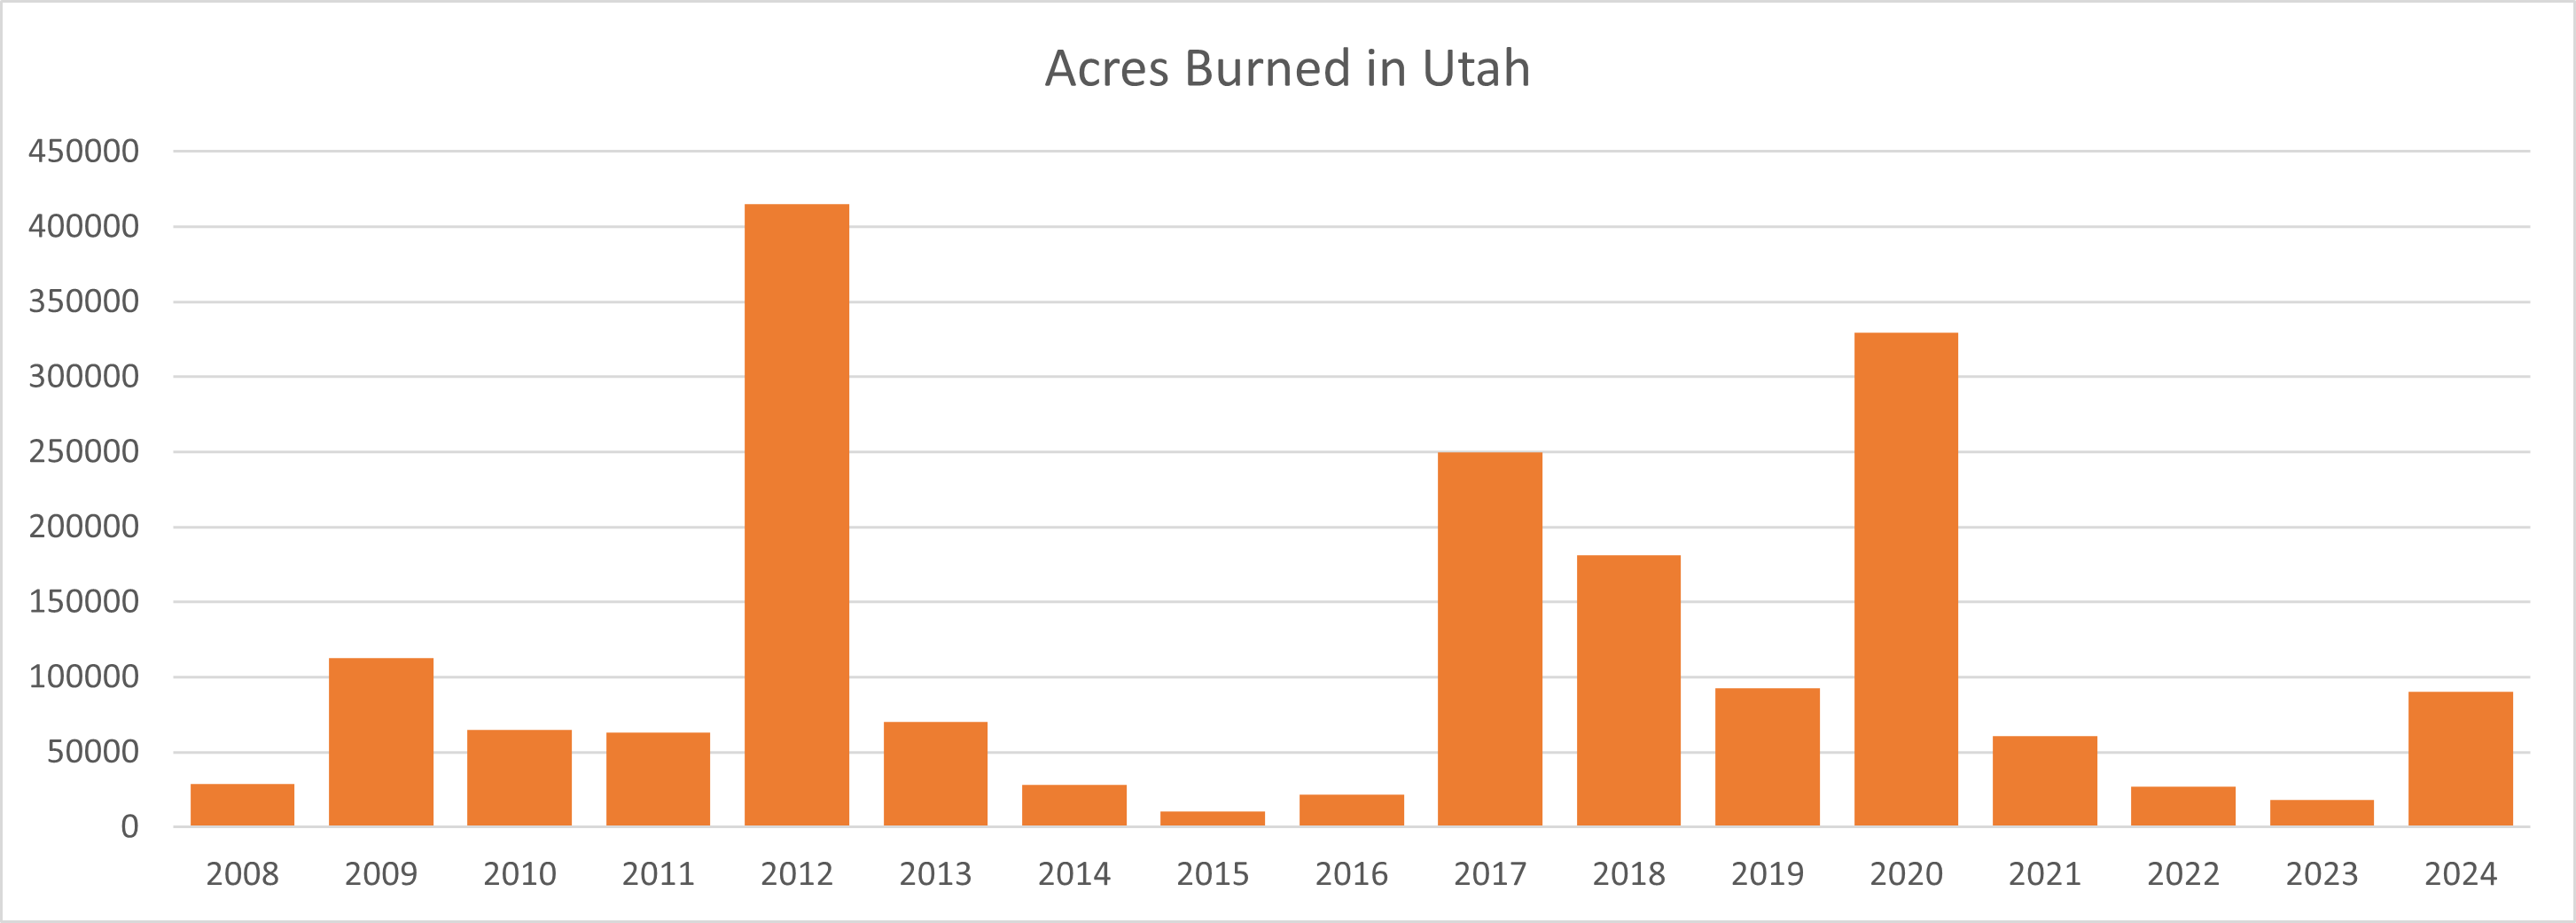
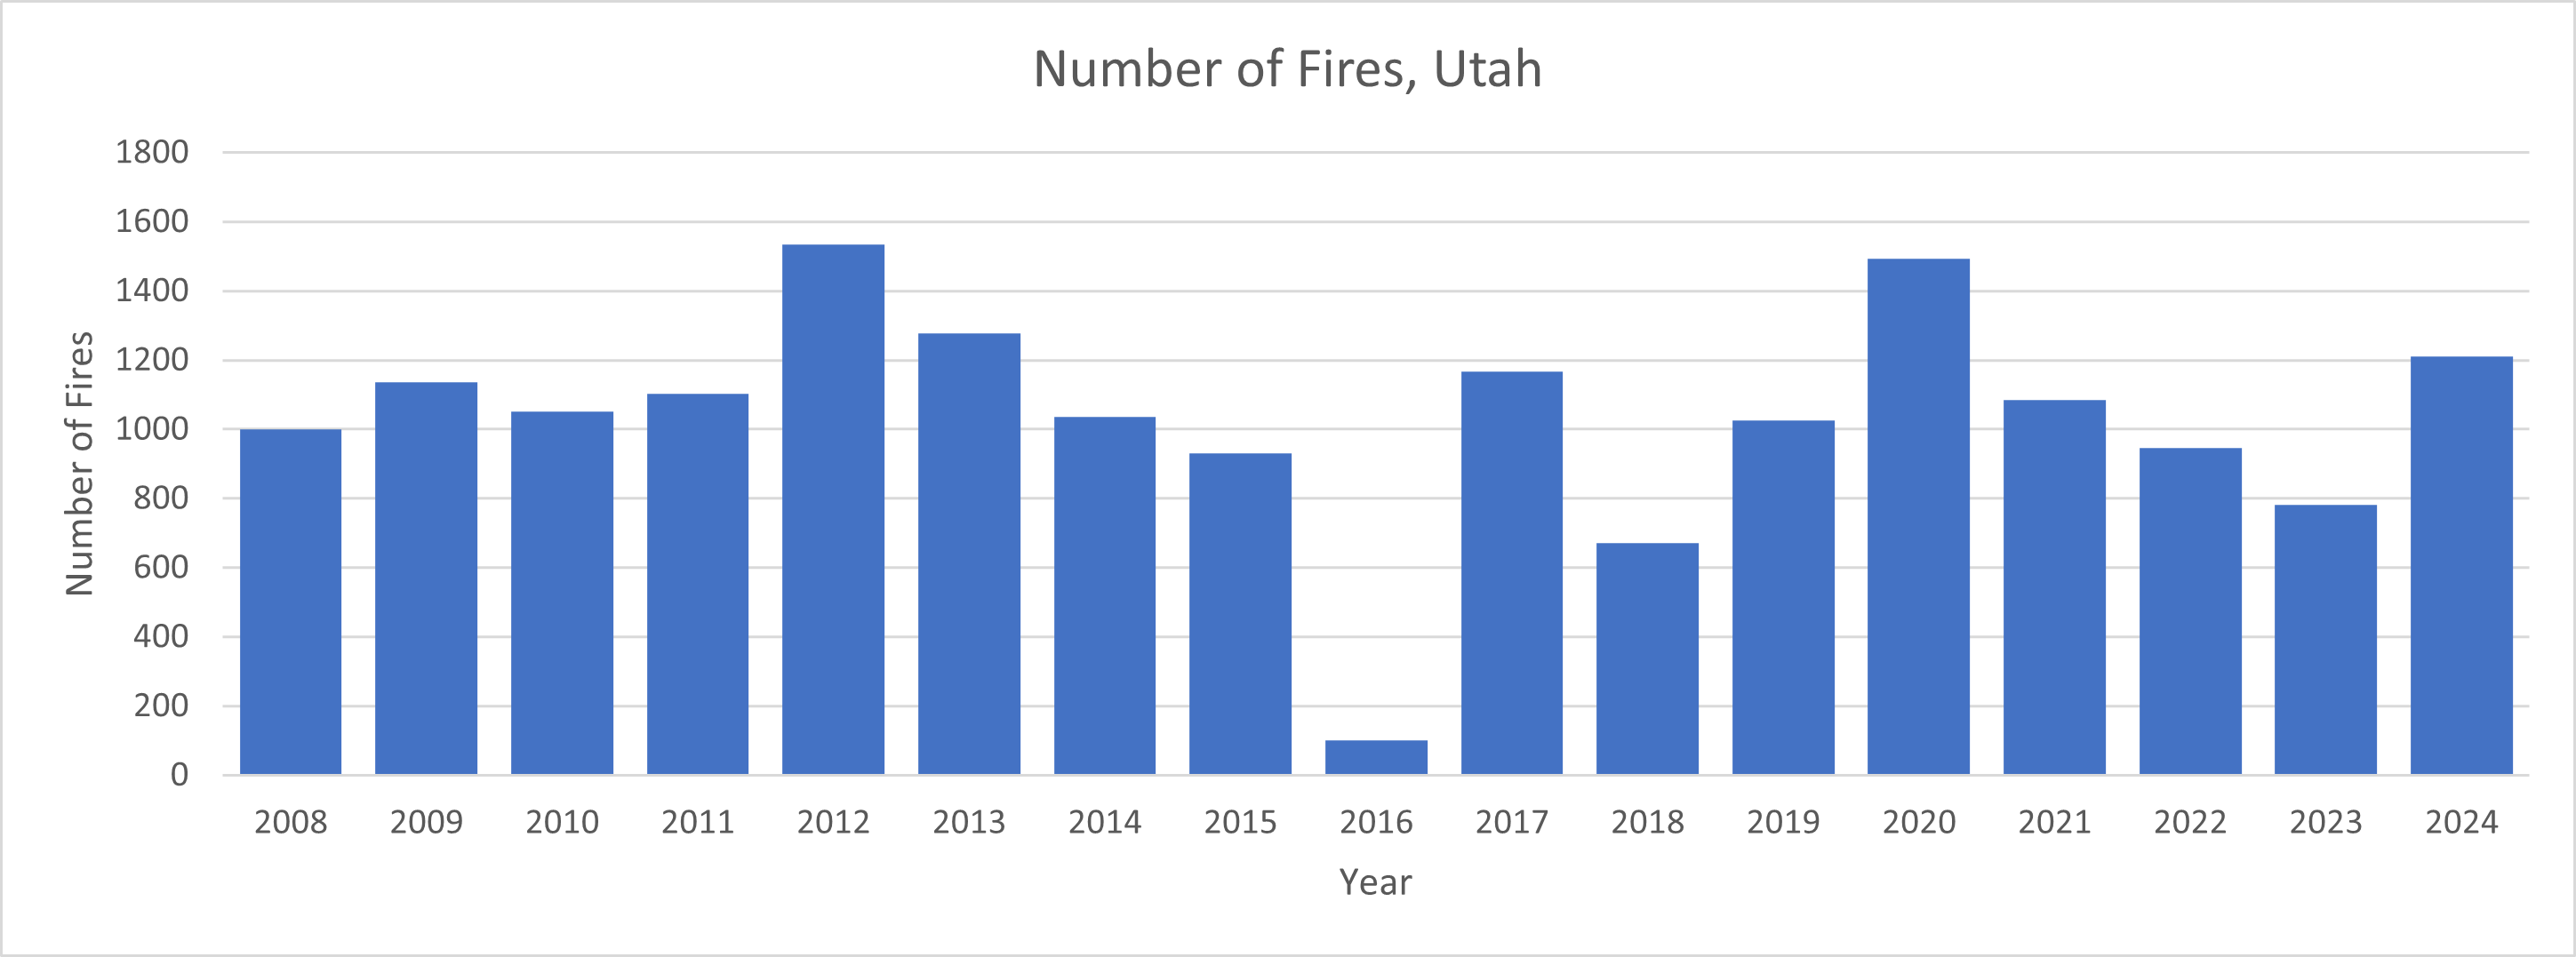
Wildfire trends in Utah have not worsened. As a matter of fact, data show Utah has not experienced an increase in the number of wildfires or total acreage burned since 2008.8
Figure 2: Acres burned per year by wildfire in Utah since 2008. Data from National Interagency Fire Center.
Figure 3: Number of wildfires in Utah since 2008. Data from National Interagency Fire Center.
Agriculture
Compared to some states, Utah is not a major crop producer. As its population has grown, thousands of acres previously devoted to crop production and raising livestock have been converted to urban and commercial use. As a result, total production yields of some of Utah’s top crops have declined. However, yields per acre of these crops have increased or remained steady.9
Hay is among Utah’s most valuable crops, as it is used to feed livestock. Since 1909, hay production has increased by 154 percent in Utah. Hay yields per acre have remained constant over the past 20 years, which suggests a modest decline in production during that period is not related to climate change but rather to a shift in crops or land use.10
The U.S. Department of Agriculture (USDA) reports Utah is the second-largest producer of tart cherries and a major producer of safflower. Year-to-year fluctuations in tart cherry production are large, but there has been a production increase of about 22 percent from 1998 to 2023. 11 Safflower production has declined since 2010, the earliest year for which data are available. However, yields per acre set a record in 2019.
In addition, Utah is known as the Beehive State, with its commercial hives used to pollinate California crops. Although not a major producer of honey, Utah’s honey production increased 17 percent from 2021 to 2023—a yield-per-hive increase of 39 percent.12
References:
Frankson, R., K.E. Kunkel, L.E. Stevens, and D.R. Easterling, Utah State Climate Summary 2022. NOAA Technical Report NESDIS 150-UT. NOAA/NESDIS, Silver Spring, MD, 5 pp. accessed March 1, 2025, https://statesummaries.ncics.org/chapter/ut/
Global, regional, and national burden of mortality associated with non-optimal ambient temperatures from 2000 to 2019: a three-stage modelling study, Qi Zhao, et al., The Lancet Planetary Health, July 2021, accessed October 7, 2022, https://doi.org/10.1016/S2542-5196(21)00081-4
Frankson, R., K.E. Kunkel, L.E. Stevens, and D.R. Easterling, 2022: Utah State Climate Summary 2022.
Since 1900, much of the rise in average temperatures in Utah is attributable to the urban heat island effect.
Precipitation rates have not significantly changed over the past century and drought has recently been lower than the historical norm.
Wildfires have not become more common or extreme.
Production and yields of Utah’s significant agricultural products have increased or remained steady in recent decades.
Short Summary:
Temperature trends:
Average temperatures in Utah have risen 2.5°F since 1900, likely driven more by urbanization at temperature station sites rather than climate change.1,2 In fact, Utah’s single day high temperature record was set in 1985, 40 years ago.
The number of nights with max temperatures measuring 75°F have increased, and the number of “very cold” nights (lows below 0°F) have decreased. These, also, are best explained by the effects of urbanization and the resulting urban heat island effect.
The highest temperature increases in the state have been measured in fast-growing cities like Salt Lake City, where the increase in artificial sources of heat retention and heat generation creates artificial localized warming that skews the average temperature for the state upward. These heat-retention and heat-generation sources typically take the form of more concrete, brick, steel, vehicles, air conditioning, heating units, and other machinery. 3
Of note, data show that Utah’s less extreme winter nights are saving lives.4
Precipitation:
As a state with a predominantly arid climate, Utah’s historical precipitation rates are low. Since 1900, overall annual precipitation has remained stable and extreme precipitation events, like those that contribute to flooding, have declined.5 Long term drought trends have also shifted downward in recent decades.
Figure 1: Chart from the NCEI Utah State Climate Summary for 2022. Values for 1895–2020 in red are based on direct measurements. Values in blue are estimated from indirect measures such as tree rings. The” fluctuating” black line is a running 20-year average. Each bar line represents a given year. The more the line extends downward, the more drought there was in that given year. Drought has clearly become less severe in Utah in recent decades.
State-Specific Issues:
Related to precipitation, alarm has been raised about decreasing water levels in the Great Salt Lake (GSL). However, because drought has not increased and rainfall patterns have been mostly constant, so-called climate change can’t be the source of the decline.
Instead, water withdrawals from the rivers and streams that feed the GSL have increased as the population has grown primarily due to increased agricultural, industrial, and residential use. In recent years, Utah has been among the fastest growing states in the country, having increased its population by approximately 22 percent.6 From 2008 to 2023, Utah’s growth rate was more than triple the national average. Unsurprisingly, this rapid and vast population increase has resulted in a decline in water levels of 11 feet since the late 1800s.7
Wildfire trends in Utah have not worsened. As a matter of fact, data show Utah has not experienced an increase in the number of wildfires or total acreage burned since 2008.8
Figure 2: Acres burned per year by wildfire in Utah since 2008. Data from National Interagency Fire Center.
Figure 3: Number of wildfires in Utah since 2008. Data from National Interagency Fire Center.
Agriculture
Compared to some states, Utah is not a major crop producer. As its population has grown, thousands of acres previously devoted to crop production and raising livestock have been converted to urban and commercial use. As a result, total production yields of some of Utah’s top crops have declined. However, yields per acre of these crops have increased or remained steady.9
Hay is among Utah’s most valuable crops, as it is used to feed livestock. Since 1909, hay production has increased by 154 percent in Utah. Hay yields per acre have remained constant over the past 20 years, which suggests a modest decline in production during that period is not related to climate change but rather to a shift in crops or land use.10
The U.S. Department of Agriculture (USDA) reports Utah is the second-largest producer of tart cherries and a major producer of safflower. Year-to-year fluctuations in tart cherry production are large, but there has been a production increase of about 22 percent from 1998 to 2023. 11 Safflower production has declined since 2010, the earliest year for which data are available. However, yields per acre set a record in 2019.
In addition, Utah is known as the Beehive State, with its commercial hives used to pollinate California crops. Although not a major producer of honey, Utah’s honey production increased 17 percent from 2021 to 2023—a yield-per-hive increase of 39 percent.12
References:
Frankson, R., K.E. Kunkel, L.E. Stevens, and D.R. Easterling, Utah State Climate Summary 2022. NOAA Technical Report NESDIS 150-UT. NOAA/NESDIS, Silver Spring, MD, 5 pp. accessed March 1, 2025, https://statesummaries.ncics.org/chapter/ut/
Global, regional, and national burden of mortality associated with non-optimal ambient temperatures from 2000 to 2019: a three-stage modelling study, Qi Zhao, et al., The Lancet Planetary Health, July 2021, accessed October 7, 2022, https://doi.org/10.1016/S2542-5196(21)00081-4
Frankson, R., K.E. Kunkel, L.E. Stevens, and D.R. Easterling, 2022: Utah State Climate Summary 2022.
We use cookies to ensure that we give you the best experience on our website. If you continue to use this site we will assume that you are happy with it.