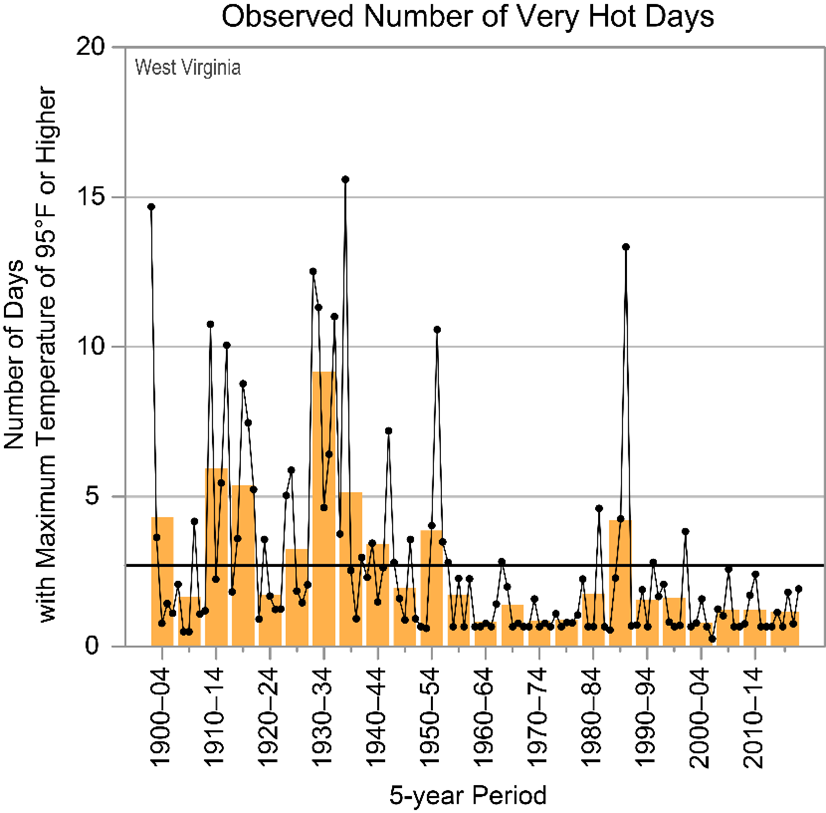
The number of very hot days has declined since 1900.
There has been a slight increase in average annual precipitation.
Flooding has not increased in severity or frequency.
Short Summary:
Temperature Trends:
West Virginia, with its topographical diversity, has three general climate regions. The northern part of the state experiences a “humid continental” climate according to Köppen classification, with hot summers and precipitation year-round. The Appalachian Mountains experience a milder climate. Subtropical conditions exist in the southwestern part of the state.1
Since 1900, average temperatures have only risen 1°F.2 This rise has not been accompanied by any increase in “very hot” days, meaning days where maximum temperatures hit 95°F or higher. There is also no long-term trend in warm nights, nor in very cold nights with temperatures below 0°F.
Figure 1: Observed number of very hot days in West Virginia since 1900. Dots are annual values. Orange bars show averages over a 5-year period, the last bar is a 6-year average. The horizontal black line shows the average of the entire period. Chart from Runkle, J., K. E. Kunkel, R. Frankson, B. C. Stewart, and J. Spaccio. West Virginia State Climate Summary 2022.
Precipitation:
Like much of the northern hemisphere, West Virginia has seen a slight increase in annual average precipitation, particularly from a low point in the late 1960s.3 This increase has not corresponded to an increase in extreme precipitation events, however, which show no trend.
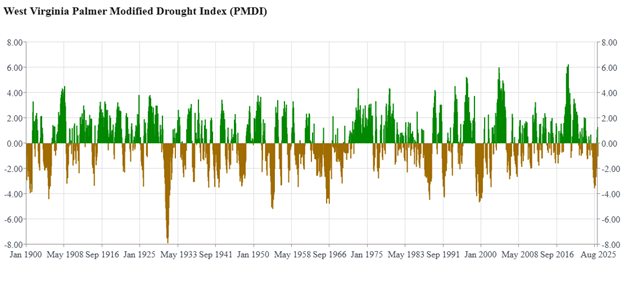
Palmer modified drought data indicate that drought conditions have not become more frequent or severe; the worst drought occurred in the 1930s, and nothing has come close since.4
Figure 2: Palmer Modified Drought Index for West Virginia, 1900–present. Brown (negative) values show drought conditions; green (positive) values show wet conditions. Chart from NOAA National Centers for Environmental information Statewide Time Series.
State-Specific Issues:
FLOODING
Because of West Virginia’s mountainous topography, flash flooding is a serious natural hazard. There has been no increase in extreme precipitation, and the annual precipitation increase is very small.
River gauge data for the Kanawha River in Charleston, West Virginia, for example, show no trend in increasing riverine flooding.5 The most severe flood in recent history occurred in 1985, when several rivers broke previous records for water height.6
SNOW
West Virginia receives on average 71 inches of snow per year, with higher amounts at higher altitudes. Data show no trend of more frequent or severe blizzards, as single-day snowfall records show no trend. The top single-day snowfall records for various counties in the state have a large spread; they were set in 2003, 2016, 1950, and 1936.7
Agriculture:
Because of the state’s rugged terrain, there is less opportunity for field crops. However, West Virginia does produce some hay, apples, and tobacco.
Hay yields in West Virginia have been relatively stable since 2000, with seasonal fluctuations. Overall, hay yields have increased 71 percent since 1900.8
Apple yield data is only available from 2007 to 2017. Over those 10 years, yields increased 33 percent.9
Tobacco yield data is available from 1900 to 2005, which shows an increase of 167 percent.10
Conclusion
West Virginia has seen very little identifiable change because of the very slight warming of the past century. Crop production continues to improve, thanks in part to a slight improvement in annual precipitation. Common deadly weather events like flooding have not increased in number or severity.
References:
“United States Koppen-Geiger Climate Classification Map.” plantmaps.com, January 20, 2024. https://www.plantmaps.com/koppen-climate-classification-map-united-states.php#google_vignette
Runkle, J., K. E. Kunkel, R. Frankson, B. C. Stewart, and J. Spaccio. West Virginia State Climate Summary 2022. NOAA Technical Report NESDIS 150-WV. NOAA/NESDIS, Silver Spring, MD, 2022. https://statesummaries.ncics.org/chapter/wv/
Ibid.
“Climate at a Glance: Statewide Time Series.” 2025. NOAA National Centers for Environmental information. September 2025. Accessed October 25, 2025.
“Kanawha River at Charleston, WV.” USGS Water Data for the Nation. Accessed October 25, 2025. https://waterdata.usgs.gov/monitoring-location/USGS-03198000/#dataTypeId=continuous-00065-0&showFieldMeasurements=true&startDT=1900-01-01&endDT=2025-01-01
“Flooding in West Virginia.” National Weather Service. https://www.weather.gov/safety/flood-states-wv
Snowfall Extremes. 2025. NOAA National Centers for Environmental Information. October 2025. Accessed October 25, 2025. https://www.ncei.noaa.gov/access/monitoring/snowfall-extremes/WV/1
U.S. Department of Agriculture. (n.d.). Hay Yield data for West Virginia. USDA/NASS QuickStats. https://quickstats.nass.usda.gov/results/F6529599-2FBD-3CA1-AAF9-97DDBA732586
U.S. Department of Agriculture. (n.d.). Apple Yield data for West Virginia. USDA/NASS QuickStats. https://quickstats.nass.usda.gov/results/D0FC9326-9E26-3FD7-A885-3315ACE39711
U.S. Department of Agriculture. (n.d.). Tobacco Yield data for West Virginia. USDA/NASS QuickStats. https://quickstats.nass.usda.gov/results/DF0DC392-0EE4-3DF5-A3EA-F72E013F6050
The number of very hot days has declined since 1900.
There has been a slight increase in average annual precipitation.
Flooding has not increased in severity or frequency.
Short Summary:
Temperature Trends:
West Virginia, with its topographical diversity, has three general climate regions. The northern part of the state experiences a “humid continental” climate according to Köppen classification, with hot summers and precipitation year-round. The Appalachian Mountains experience a milder climate. Subtropical conditions exist in the southwestern part of the state.1
Since 1900, average temperatures have only risen 1°F.2 This rise has not been accompanied by any increase in “very hot” days, meaning days where maximum temperatures hit 95°F or higher. There is also no long-term trend in warm nights, nor in very cold nights with temperatures below 0°F.
Figure 1: Observed number of very hot days in West Virginia since 1900. Dots are annual values. Orange bars show averages over a 5-year period, the last bar is a 6-year average. The horizontal black line shows the average of the entire period. Chart from Runkle, J., K. E. Kunkel, R. Frankson, B. C. Stewart, and J. Spaccio. West Virginia State Climate Summary 2022.
Precipitation:
Like much of the northern hemisphere, West Virginia has seen a slight increase in annual average precipitation, particularly from a low point in the late 1960s.3 This increase has not corresponded to an increase in extreme precipitation events, however, which show no trend.
Palmer modified drought data indicate that drought conditions have not become more frequent or severe; the worst drought occurred in the 1930s, and nothing has come close since.4
Figure 2: Palmer Modified Drought Index for West Virginia, 1900–present. Brown (negative) values show drought conditions; green (positive) values show wet conditions. Chart from NOAA National Centers for Environmental information Statewide Time Series.
State-Specific Issues:
FLOODING
Because of West Virginia’s mountainous topography, flash flooding is a serious natural hazard. There has been no increase in extreme precipitation, and the annual precipitation increase is very small.
River gauge data for the Kanawha River in Charleston, West Virginia, for example, show no trend in increasing riverine flooding.5 The most severe flood in recent history occurred in 1985, when several rivers broke previous records for water height.6
SNOW
West Virginia receives on average 71 inches of snow per year, with higher amounts at higher altitudes. Data show no trend of more frequent or severe blizzards, as single-day snowfall records show no trend. The top single-day snowfall records for various counties in the state have a large spread; they were set in 2003, 2016, 1950, and 1936.7
Agriculture:
Because of the state’s rugged terrain, there is less opportunity for field crops. However, West Virginia does produce some hay, apples, and tobacco.
Hay yields in West Virginia have been relatively stable since 2000, with seasonal fluctuations. Overall, hay yields have increased 71 percent since 1900.8
Apple yield data is only available from 2007 to 2017. Over those 10 years, yields increased 33 percent.9
Tobacco yield data is available from 1900 to 2005, which shows an increase of 167 percent.10
Conclusion
West Virginia has seen very little identifiable change because of the very slight warming of the past century. Crop production continues to improve, thanks in part to a slight improvement in annual precipitation. Common deadly weather events like flooding have not increased in number or severity.
References:
“United States Koppen-Geiger Climate Classification Map.” plantmaps.com, January 20, 2024. https://www.plantmaps.com/koppen-climate-classification-map-united-states.php#google_vignette
Runkle, J., K. E. Kunkel, R. Frankson, B. C. Stewart, and J. Spaccio. West Virginia State Climate Summary 2022. NOAA Technical Report NESDIS 150-WV. NOAA/NESDIS, Silver Spring, MD, 2022. https://statesummaries.ncics.org/chapter/wv/
Ibid.
“Climate at a Glance: Statewide Time Series.” 2025. NOAA National Centers for Environmental information. September 2025. Accessed October 25, 2025.
“Kanawha River at Charleston, WV.” USGS Water Data for the Nation. Accessed October 25, 2025. https://waterdata.usgs.gov/monitoring-location/USGS-03198000/#dataTypeId=continuous-00065-0&showFieldMeasurements=true&startDT=1900-01-01&endDT=2025-01-01
“Flooding in West Virginia.” National Weather Service. https://www.weather.gov/safety/flood-states-wv
Snowfall Extremes. 2025. NOAA National Centers for Environmental Information. October 2025. Accessed October 25, 2025. https://www.ncei.noaa.gov/access/monitoring/snowfall-extremes/WV/1
U.S. Department of Agriculture. (n.d.). Hay Yield data for West Virginia. USDA/NASS QuickStats. https://quickstats.nass.usda.gov/results/F6529599-2FBD-3CA1-AAF9-97DDBA732586
U.S. Department of Agriculture. (n.d.). Apple Yield data for West Virginia. USDA/NASS QuickStats. https://quickstats.nass.usda.gov/results/D0FC9326-9E26-3FD7-A885-3315ACE39711
U.S. Department of Agriculture. (n.d.). Tobacco Yield data for West Virginia. USDA/NASS QuickStats. https://quickstats.nass.usda.gov/results/DF0DC392-0EE4-3DF5-A3EA-F72E013F6050
We use cookies to ensure that we give you the best experience on our website. If you continue to use this site we will assume that you are happy with it.