Since the 1950s, average temperatures have risen approximately 2 degrees.
There have been fewer extreme precipitation events in recent decades amid slightly drier conditions overall.
Tropical cyclones affecting Hawaii have not increased.
Hawaii has seen an increase in wildfires, largely due to land-cover changes and increases in human ignitions.
Hawaiian agriculture is heavily impacted by international competition, but staple crops for the economy are relatively stable.
Short Summary:
Temperature Trends:
Hawaii is one of the most unique states in terms of climate and habitat, being mostly tropical, split between savannah on the leeward sides of the islands and rainforest on the windward sides. This means the state naturally receives plentiful precipitation and has warm weather with only moderate differences between seasons.1 The weather in Hawaii is strongly influenced by the Pacific trade winds and changes in the Pacific between El Niño and La Niña conditions, which lead to drier or wetter weather, respectively.
Climate data in general are very limited for Hawaii. Temperature records only go back to 1950, and over that period average temperature has risen by approximately 2°F.2
Unlike most states, the number of both “hot days” and warmer nights has increased over the past decade. However, due to a lack of long-term temperature data, this cannot be classified as a climate trend.3 Some of the rise has to do with population growth and related urban development. Hawaii’s population exploded from fewer than 800,000 in 1970 to more than 1.4 million today.4 Research indicates that 22 percent of the warming trend recorded at U.S. surface stations can be attributed to population growth and urbanization, with more urban heat island (UHI)-driven warming recorded at suburban and urban locations.5
Precipitation:
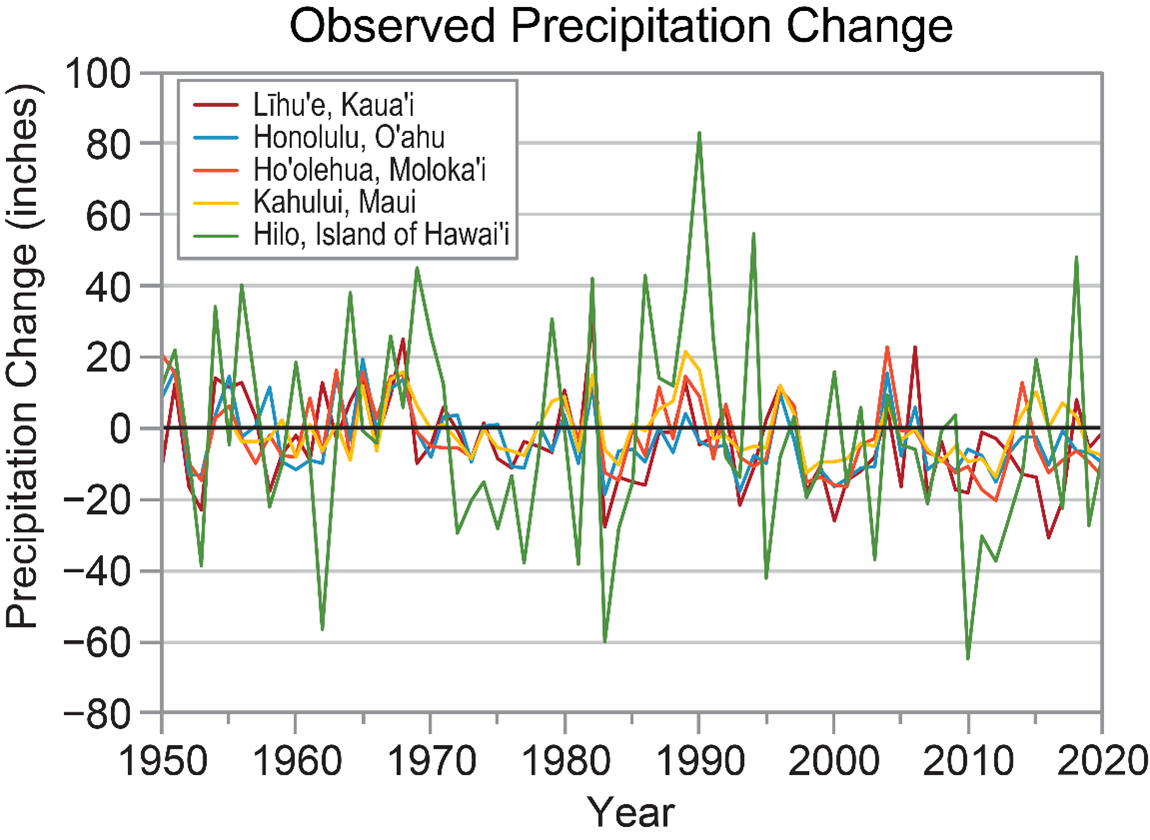
Since the 1980s, Hawaii has experienced conditions that are modestly drier than normal, particularly in the Kona region of the Big Island. Some scientists propose that the eruption of the Kilauea Volcano is a large factor, preventing rainfall in the area.6
Figure 1: Precipitation changes compared to the 1951-1980 average for the five long-term reporting stations in Hawaii. Chart produced by L.E. Stevens et al, sources are CISESS and NOAA NCEI. Data from GHCN-Daily.
This relative dryness has been accompanied by fewer extreme precipitation events than average.7
State-Specific Issues:
Tropical Storms:
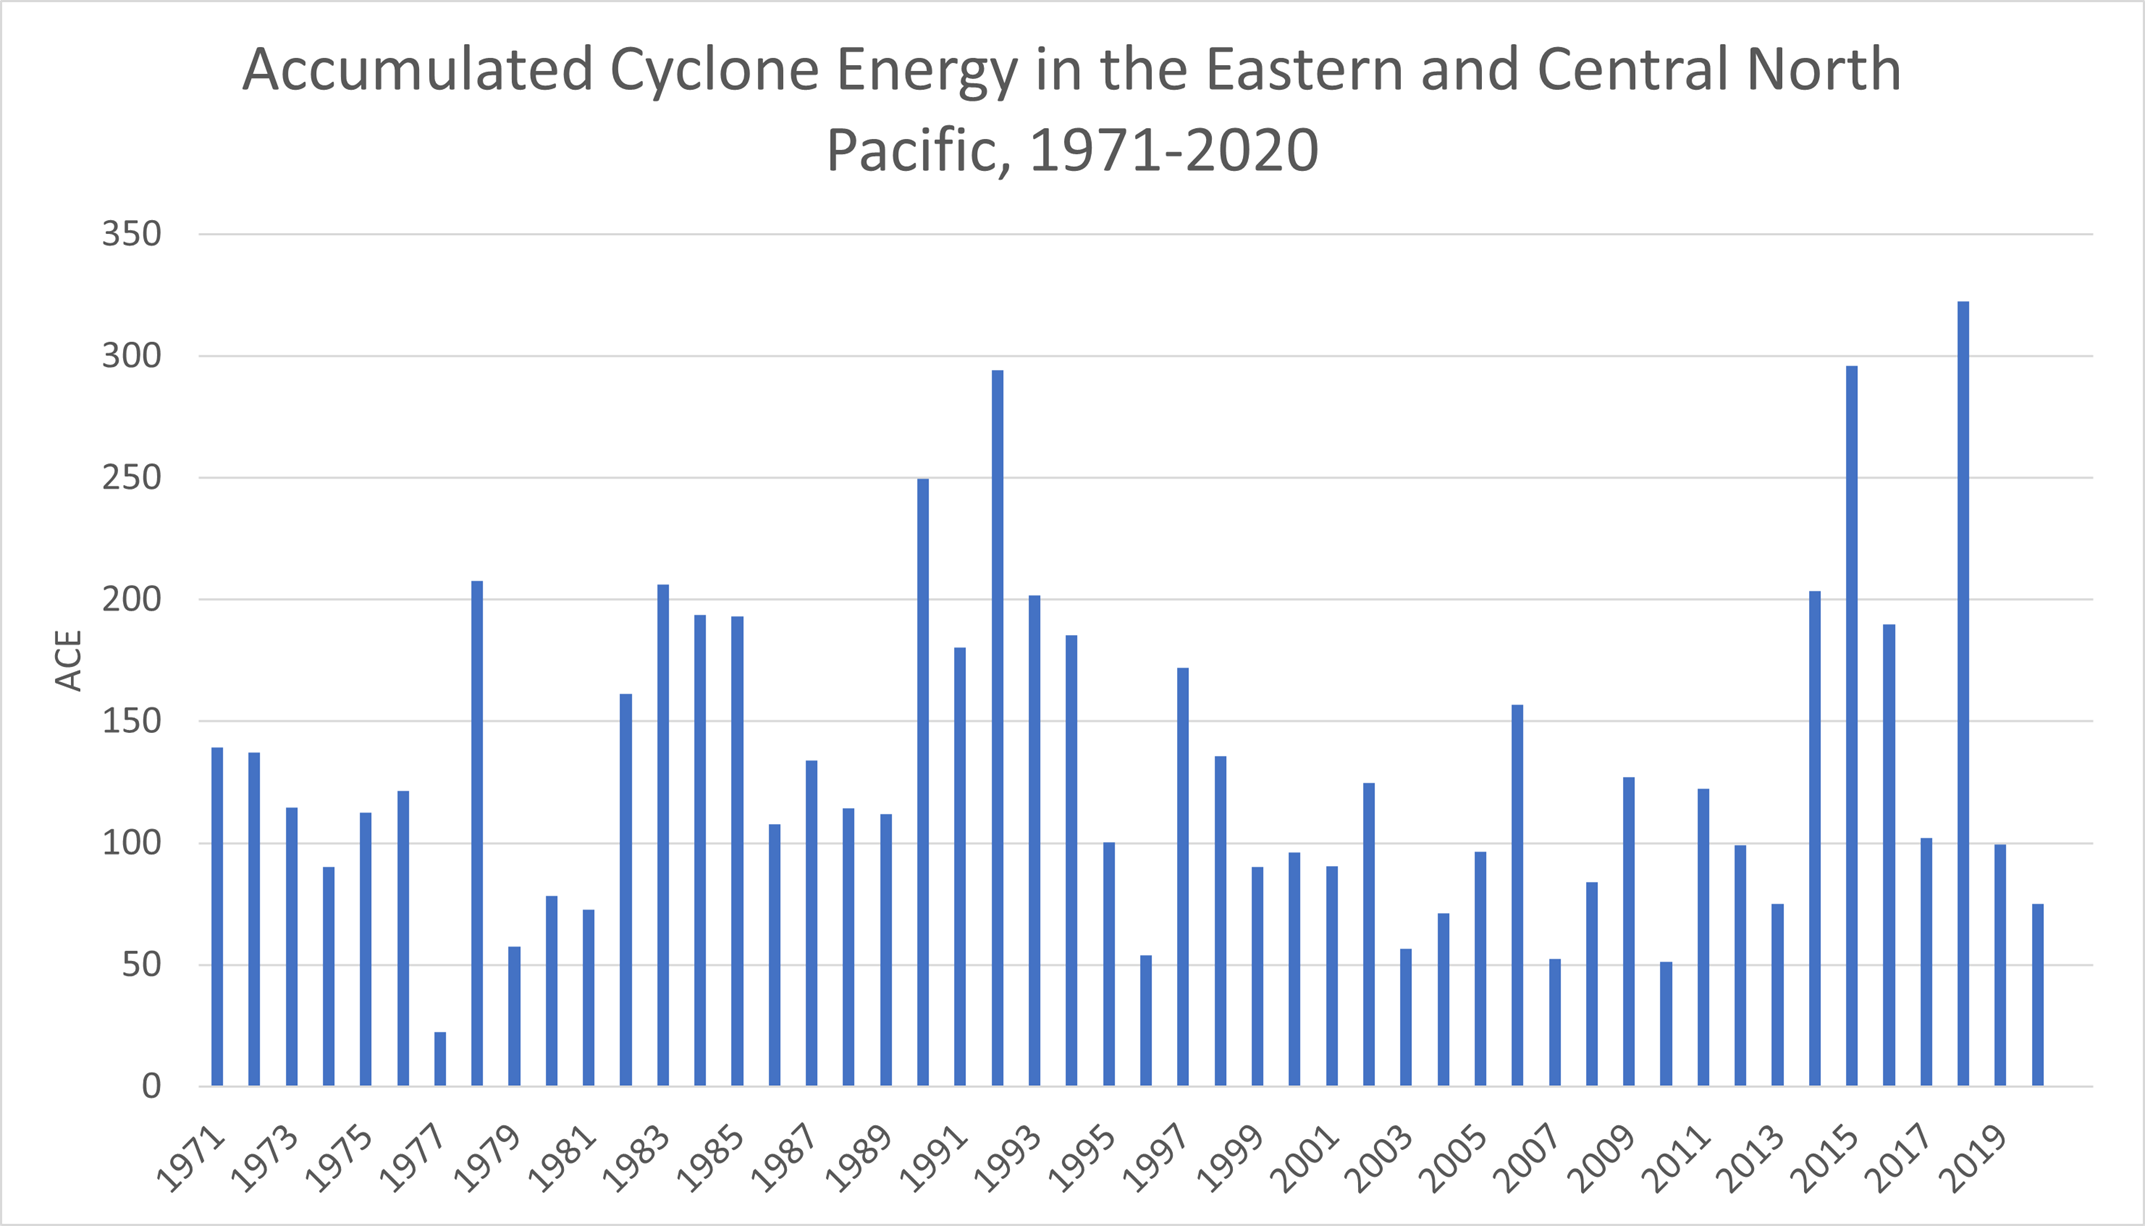
Hawaii does not get hit by hurricanes often. Data show very few landfalls of tropical storms or hurricanes on the Hawaiian Islands,8 but the islands do receive the tropical remnants of those storms. The Eastern and Central Pacific in general has seen no particular trend in Accumulated Cyclone Energy (ACE) – a metric for comparing the overall tropical cyclone activity.9
Figure 2: Accumulated Cyclone Energy for Eastern and Central North Pacific from 1971-2020, data from Maue, Global Tropical Cyclone Activity data at https://climatlas.com/tropical/
Wildfires
Hawaii has historically been prone to wildfires on the leeward sides of the islands, but these fires were less common prior to the large population growth and European settlement. Wildfires have increased as land previously used and managed as pasture, pineapple, and sugarcane farms were abandoned and overtaken by very flammable weeds and non-native grasses.10 Native Hawaiian plants do not recover well after being burned, which has allowed even more expansion of non-native weeds, exacerbating fire danger.
Sea Level
Hawaii is a volcanic island archipelago, formed by a stationary volcanic “hotspot” underwater that forms islands in a chain as the Pacific plate moves over it. The islands in the northwest are the oldest, while the southeastern islands like Hawaii’s Big Island are millions of years younger. Over time, the oldest trailing islands are eroded by the ocean waves, and are eventually completely submerged. This is a natural process, and does impact relative sea level for the island chain.
Relative sea level rise in Hawaii depends on each specific island, with the lowest rate measured at Honolulu (1.57 mm/year) and the fastest at Kawaihae (3.81 mm/year).11 Honolulu’s measurement equals about six inches of rise over a century, and Kawaihae one and a quarter foot over a century. These rates are lower than the global average rate of sea level rise.
Agriculture:
Hawaii was once a dominant producer of pineapple and sugarcane, but these historic crops have declined due to competition from other countries with less expensive labor. However, Hawaii still produces sugarcane, along with macadamia nuts, coffee, and many tropical fruits.12
Data from 1934 to 2016 show that production of sugarcane declined from its earlier peaks as the planted acreage has been reduced, but yields per acre modestly increased by about 44 percent in that same period.13
Macadamia nut production increased gradually from the 1950s to 1990s,14 peaking around 2006-07,15 and has fluctuated since then but generally stayed in line with 1990s averages.16 Overall, Hawaii produces five times more macadamia nuts today than it did in the 1940s.
Coffee production and yield have been tracked inconsistently in Hawaii. Coffee production has had large swings since the crop was introduced in the early 1800s, mostly due to international competition but also outbreaks of disease and recent wildfire damage. From 2014 to 2025, where there are consistent reporting methodology, production and yields have slightly declined.17
Conclusion:
While Hawaii has experienced modestly warmer temperatures and a slight decline in precipitation over recent decades, there is no evidence that it is substantial or problematic. Recent wildfire issues are connected to land use changes and invasive species, but extreme weather has not worsened in general across the islands. Meanwhile, yields of major agricultural crops like sugarcane and macadamia nuts are stable or have increased.
“Urban Heat Island Effects in U.S. Summer Surface Temperature Data, 1895–2023,” Journal of Applied Meteorology and Climatology, https://doi.org/10.1175/JAMC-D-23-0199
Since the 1950s, average temperatures have risen approximately 2 degrees.
There have been fewer extreme precipitation events in recent decades amid slightly drier conditions overall.
Tropical cyclones affecting Hawaii have not increased.
Hawaii has seen an increase in wildfires, largely due to land-cover changes and increases in human ignitions.
Hawaiian agriculture is heavily impacted by international competition, but staple crops for the economy are relatively stable.
Short Summary:
Temperature Trends:
Hawaii is one of the most unique states in terms of climate and habitat, being mostly tropical, split between savannah on the leeward sides of the islands and rainforest on the windward sides. This means the state naturally receives plentiful precipitation and has warm weather with only moderate differences between seasons.1 The weather in Hawaii is strongly influenced by the Pacific trade winds and changes in the Pacific between El Niño and La Niña conditions, which lead to drier or wetter weather, respectively.
Climate data in general are very limited for Hawaii. Temperature records only go back to 1950, and over that period average temperature has risen by approximately 2°F.2
Unlike most states, the number of both “hot days” and warmer nights has increased over the past decade. However, due to a lack of long-term temperature data, this cannot be classified as a climate trend.3 Some of the rise has to do with population growth and related urban development. Hawaii’s population exploded from fewer than 800,000 in 1970 to more than 1.4 million today.4 Research indicates that 22 percent of the warming trend recorded at U.S. surface stations can be attributed to population growth and urbanization, with more urban heat island (UHI)-driven warming recorded at suburban and urban locations.5
Precipitation:
Since the 1980s, Hawaii has experienced conditions that are modestly drier than normal, particularly in the Kona region of the Big Island. Some scientists propose that the eruption of the Kilauea Volcano is a large factor, preventing rainfall in the area.6
Figure 1: Precipitation changes compared to the 1951-1980 average for the five long-term reporting stations in Hawaii. Chart produced by L.E. Stevens et al, sources are CISESS and NOAA NCEI. Data from GHCN-Daily.
This relative dryness has been accompanied by fewer extreme precipitation events than average.7
State-Specific Issues:
Tropical Storms:
Hawaii does not get hit by hurricanes often. Data show very few landfalls of tropical storms or hurricanes on the Hawaiian Islands,8 but the islands do receive the tropical remnants of those storms. The Eastern and Central Pacific in general has seen no particular trend in Accumulated Cyclone Energy (ACE) – a metric for comparing the overall tropical cyclone activity.9
Figure 2: Accumulated Cyclone Energy for Eastern and Central North Pacific from 1971-2020, data from Maue, Global Tropical Cyclone Activity data at https://climatlas.com/tropical/
Wildfires
Hawaii has historically been prone to wildfires on the leeward sides of the islands, but these fires were less common prior to the large population growth and European settlement. Wildfires have increased as land previously used and managed as pasture, pineapple, and sugarcane farms were abandoned and overtaken by very flammable weeds and non-native grasses.10 Native Hawaiian plants do not recover well after being burned, which has allowed even more expansion of non-native weeds, exacerbating fire danger.
Sea Level
Hawaii is a volcanic island archipelago, formed by a stationary volcanic “hotspot” underwater that forms islands in a chain as the Pacific plate moves over it. The islands in the northwest are the oldest, while the southeastern islands like Hawaii’s Big Island are millions of years younger. Over time, the oldest trailing islands are eroded by the ocean waves, and are eventually completely submerged. This is a natural process, and does impact relative sea level for the island chain.
Relative sea level rise in Hawaii depends on each specific island, with the lowest rate measured at Honolulu (1.57 mm/year) and the fastest at Kawaihae (3.81 mm/year).11 Honolulu’s measurement equals about six inches of rise over a century, and Kawaihae one and a quarter foot over a century. These rates are lower than the global average rate of sea level rise.
Agriculture:
Hawaii was once a dominant producer of pineapple and sugarcane, but these historic crops have declined due to competition from other countries with less expensive labor. However, Hawaii still produces sugarcane, along with macadamia nuts, coffee, and many tropical fruits.12
Data from 1934 to 2016 show that production of sugarcane declined from its earlier peaks as the planted acreage has been reduced, but yields per acre modestly increased by about 44 percent in that same period.13
Macadamia nut production increased gradually from the 1950s to 1990s,14 peaking around 2006-07,15 and has fluctuated since then but generally stayed in line with 1990s averages.16 Overall, Hawaii produces five times more macadamia nuts today than it did in the 1940s.
Coffee production and yield have been tracked inconsistently in Hawaii. Coffee production has had large swings since the crop was introduced in the early 1800s, mostly due to international competition but also outbreaks of disease and recent wildfire damage. From 2014 to 2025, where there are consistent reporting methodology, production and yields have slightly declined.17
Conclusion:
While Hawaii has experienced modestly warmer temperatures and a slight decline in precipitation over recent decades, there is no evidence that it is substantial or problematic. Recent wildfire issues are connected to land use changes and invasive species, but extreme weather has not worsened in general across the islands. Meanwhile, yields of major agricultural crops like sugarcane and macadamia nuts are stable or have increased.
“Urban Heat Island Effects in U.S. Summer Surface Temperature Data, 1895–2023,” Journal of Applied Meteorology and Climatology, https://doi.org/10.1175/JAMC-D-23-0199
We use cookies to ensure that we give you the best experience on our website. If you continue to use this site we will assume that you are happy with it.