The number of days and nights with extreme heat have both declined in Illinois since the 1930s.
Average warming is driven by warmer low temperatures influenced by the urban heat island effect.
Since 1900, average precipitation has increased gradually, with drought becoming less severe.
There has been no trend for either tornadoes or extreme hail.
Agricultural staples like corn and soybeans have increased massively over the past century, with soybean production 500 times higher today.
Short Summary:
Temperature Trends:
Illinois is dominated by a humid continental climate according to Köppen classification, which means that winters tend to be below freezing and summers are hot, with plenty of precipitation year-round.1
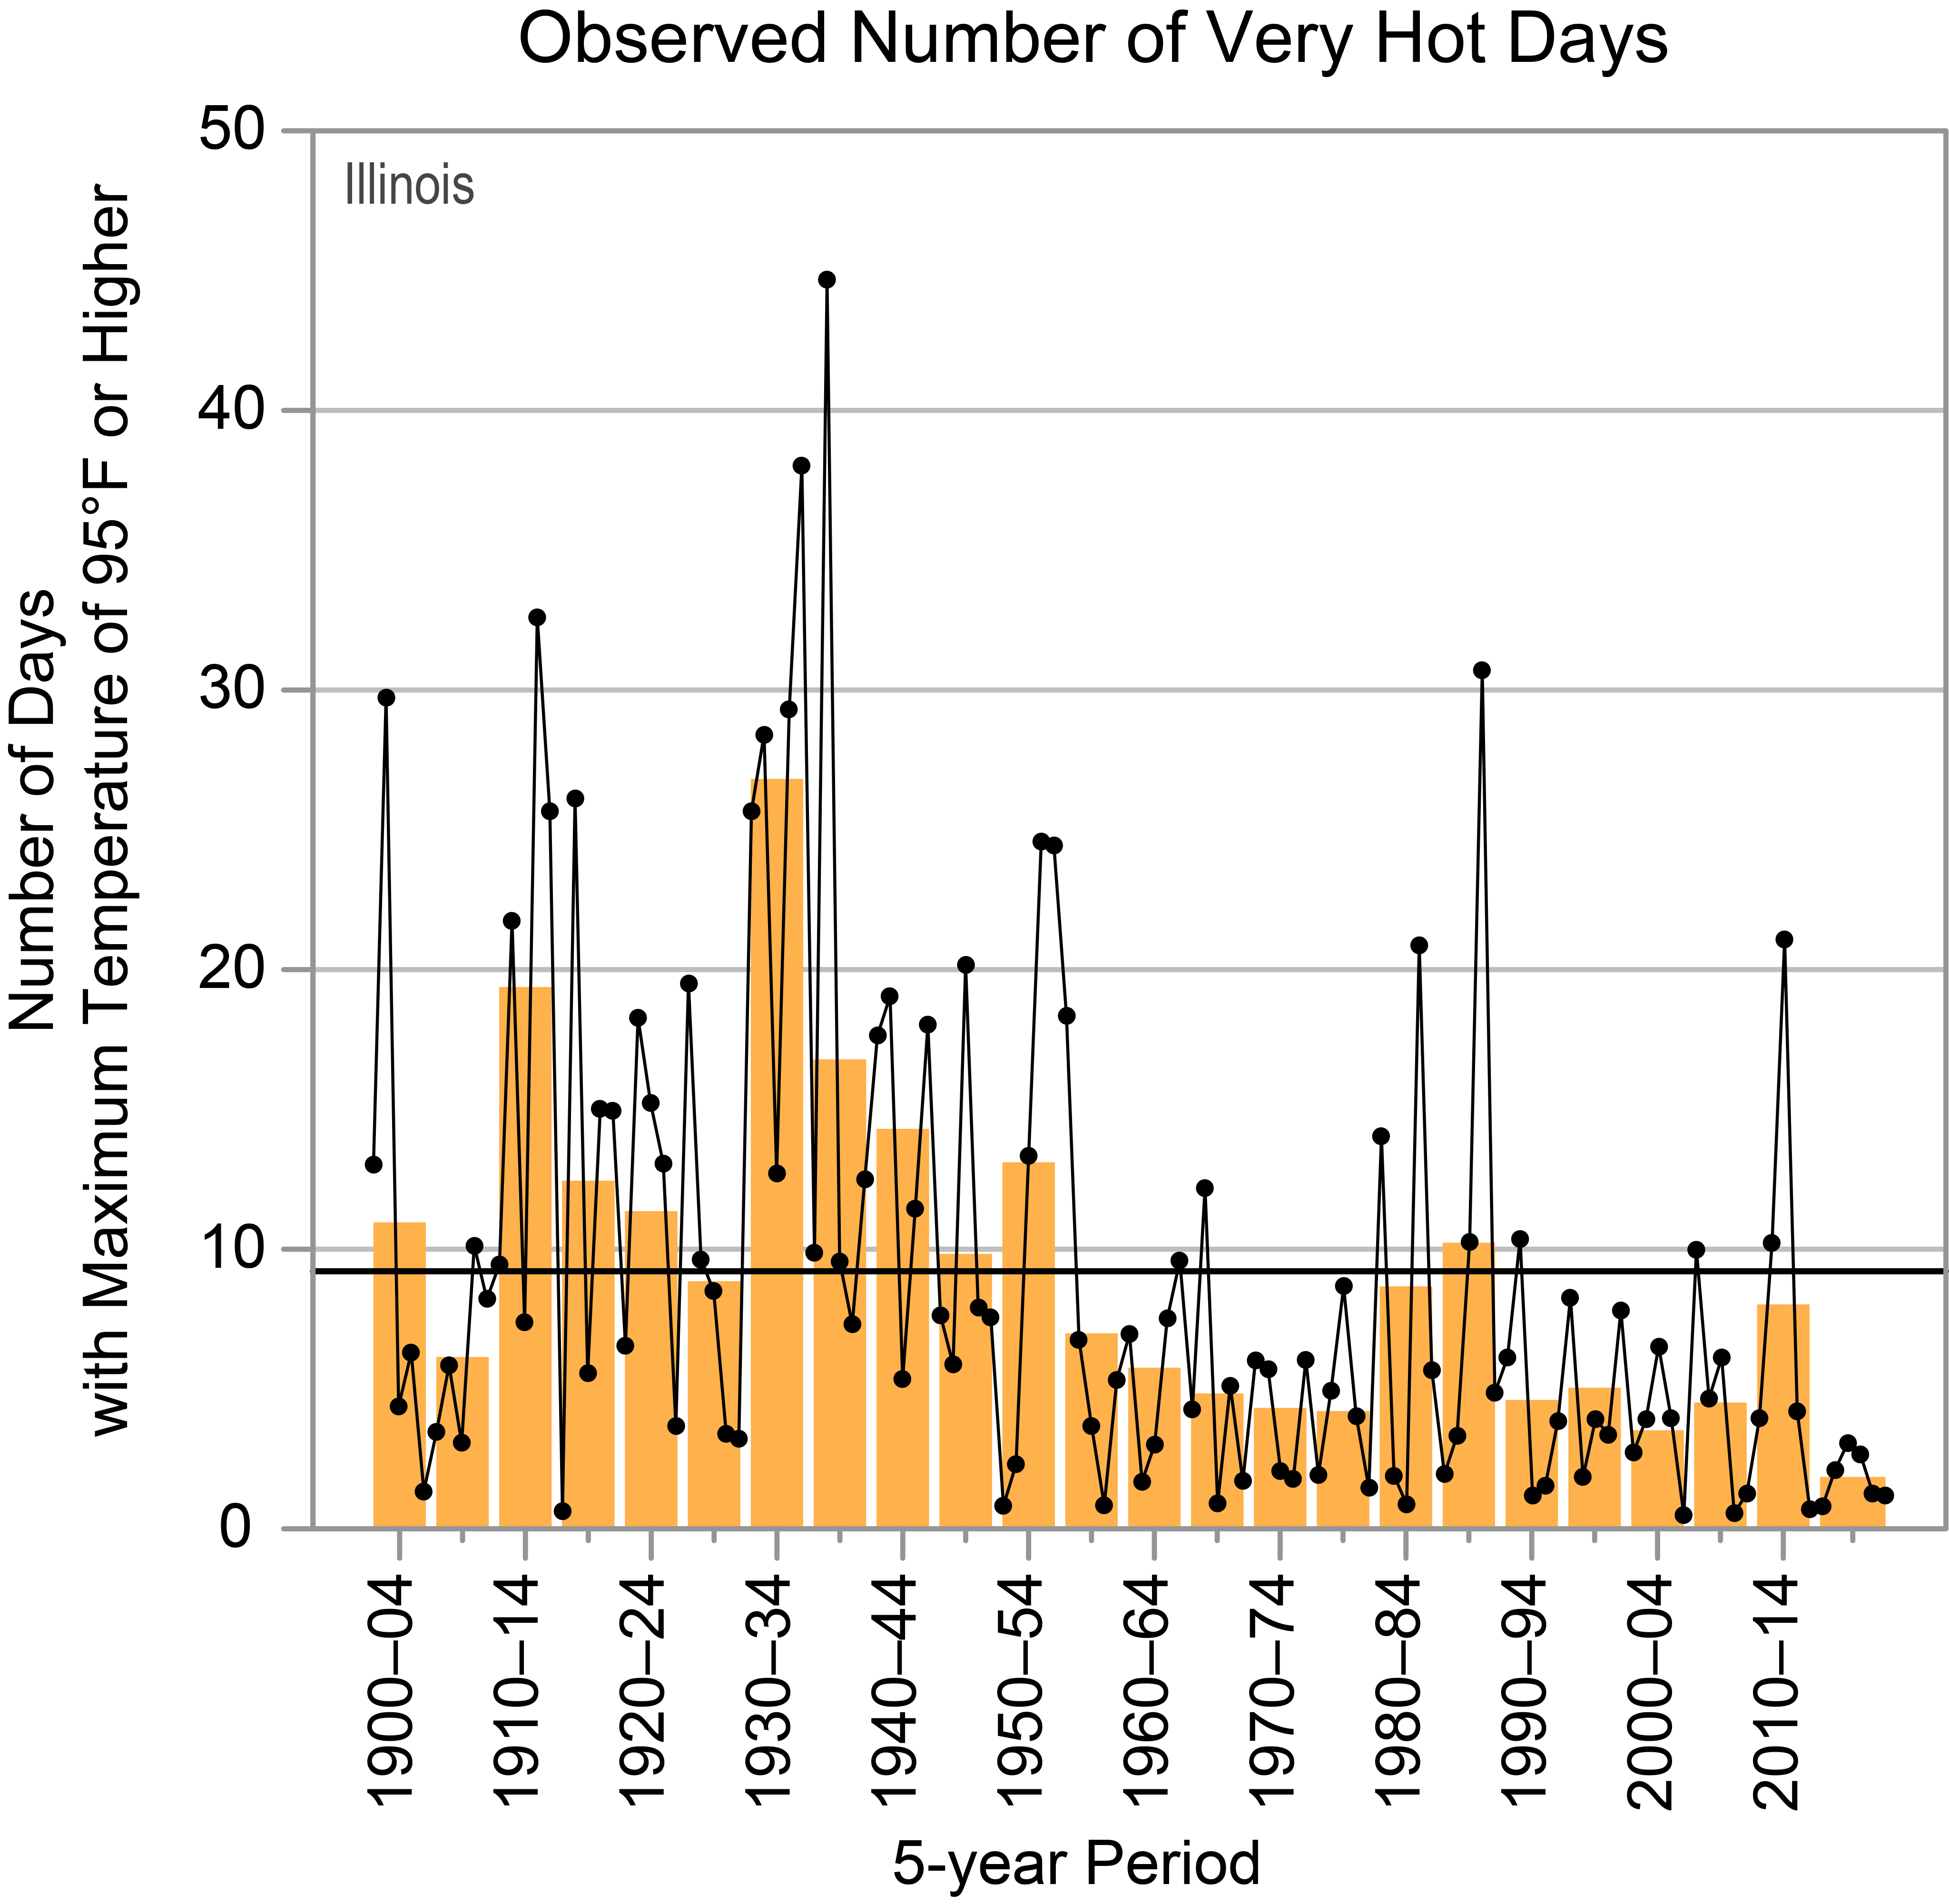
Average temperatures have risen approximately 1.5°F in Illinois since 1900; however, this is not driven by hotter days. The number of “very hot” (95°F or higher) days and “very warm” (75°F or higher) nights have both significantly declined since peaks in the 1930s.2 The warming trend is driven mainly by a decline in the number of very cold (0°F and below) nights, especially in winter months. This is not a bad thing for public health: extremely cold temperatures kill far more people than extremely hot temperatures.3 Shorter winters and longer growing seasons also improve conditions for crops and native plants.
Recent research strongly suggests that much of the nighttime warming in Illinois since 1900 is likely due to the urban heat island effect, driven by increasing urbanization and population density.4
Figure 1: Annual number of “days with a maximum temperature of 95°F or higher. Orange bars show averages over five-year period, with the last bar a six-year average. Dots are yearly values, and the horizontal line shows the long-term average. Chart from Frankson, R., K.E. Kunkel, S.M. Champion, et al, 2022: Illinois State Climate Summary 2022.
Precipitation:
Annual precipitation has gradually increased in Illinois since 1900,5 and there has been an increase in what are called days with “2-inch extreme precipitation events,” but only from an average of approximately 1.5 days per year to less than 2.5 days per year.6
Drought has become less severe in recent decades, with the worst historical droughts having occurred in the 1930s-1950s.7
State-Specific Issues:
Tornadoes
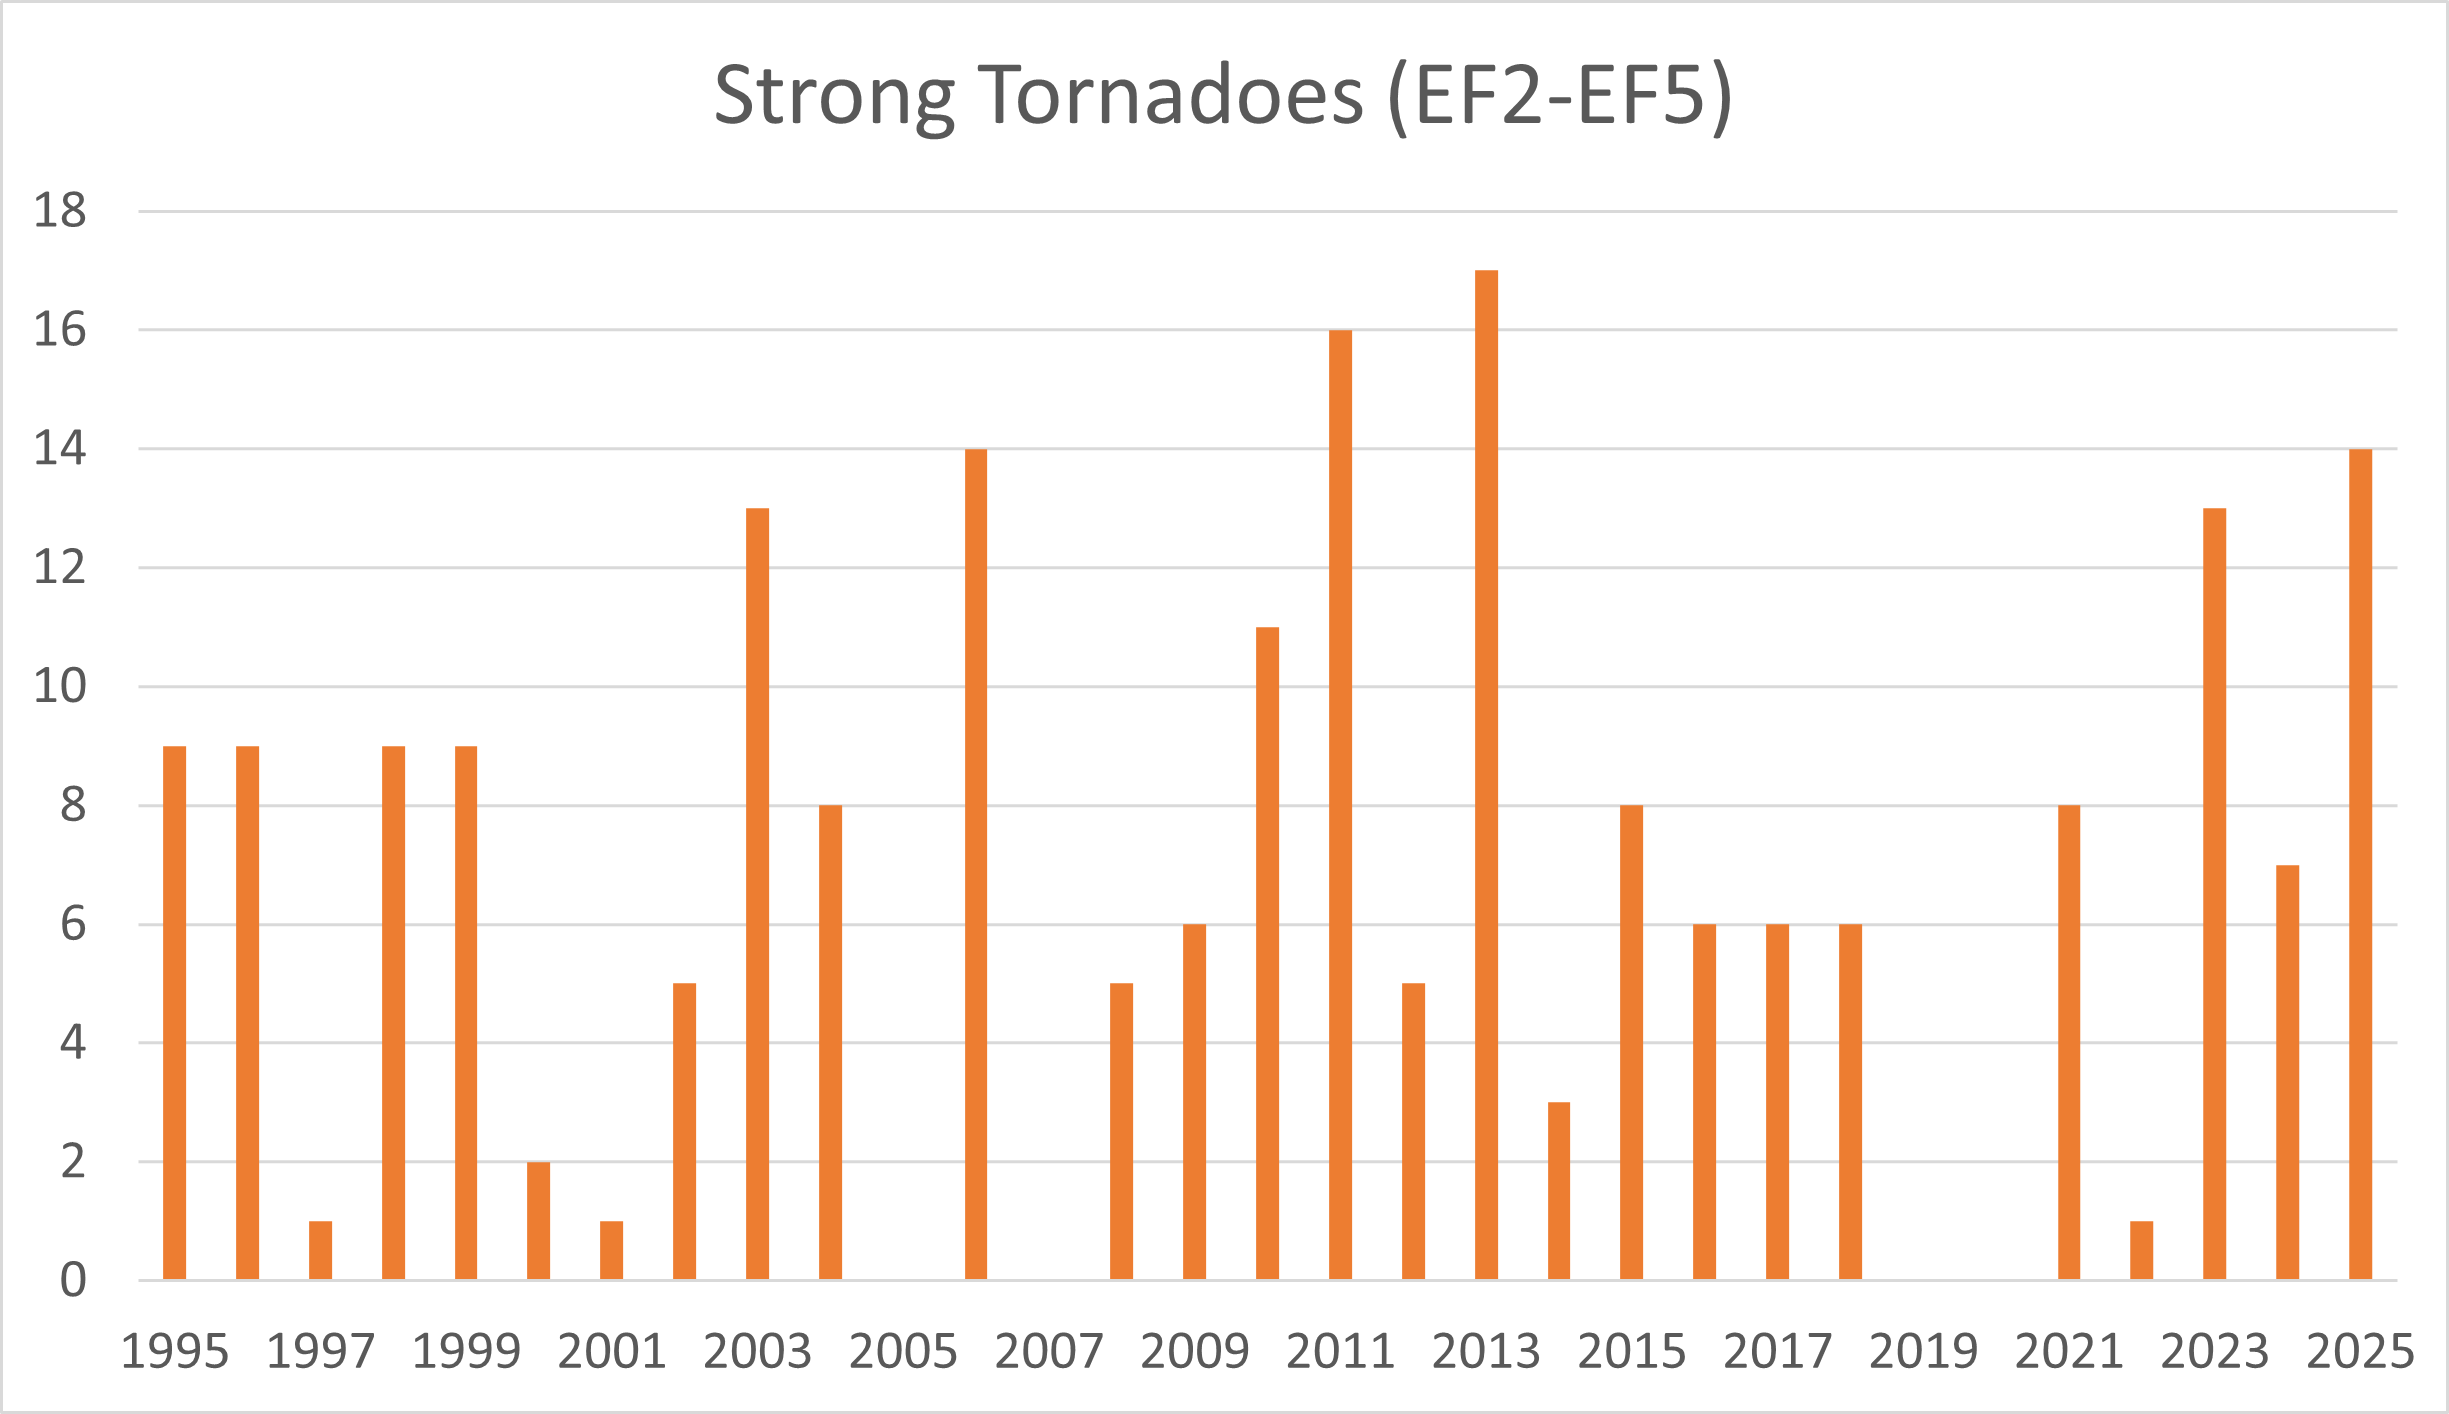
Tornadoes are common in Illinois, especially in the spring and summer. Total tornadoes since the advent of improved observation coverage and Doppler radar show no trend of tornadoes becoming more frequent or severe.8 There is no trend whatsoever in the number of strong (EF2+) tornadoes over the past three decades.9
Figure 2: Strong (EF2+) tornadoes in Illinois from 1995-2025. Data from NWS Storm Prediction Center.
Hail
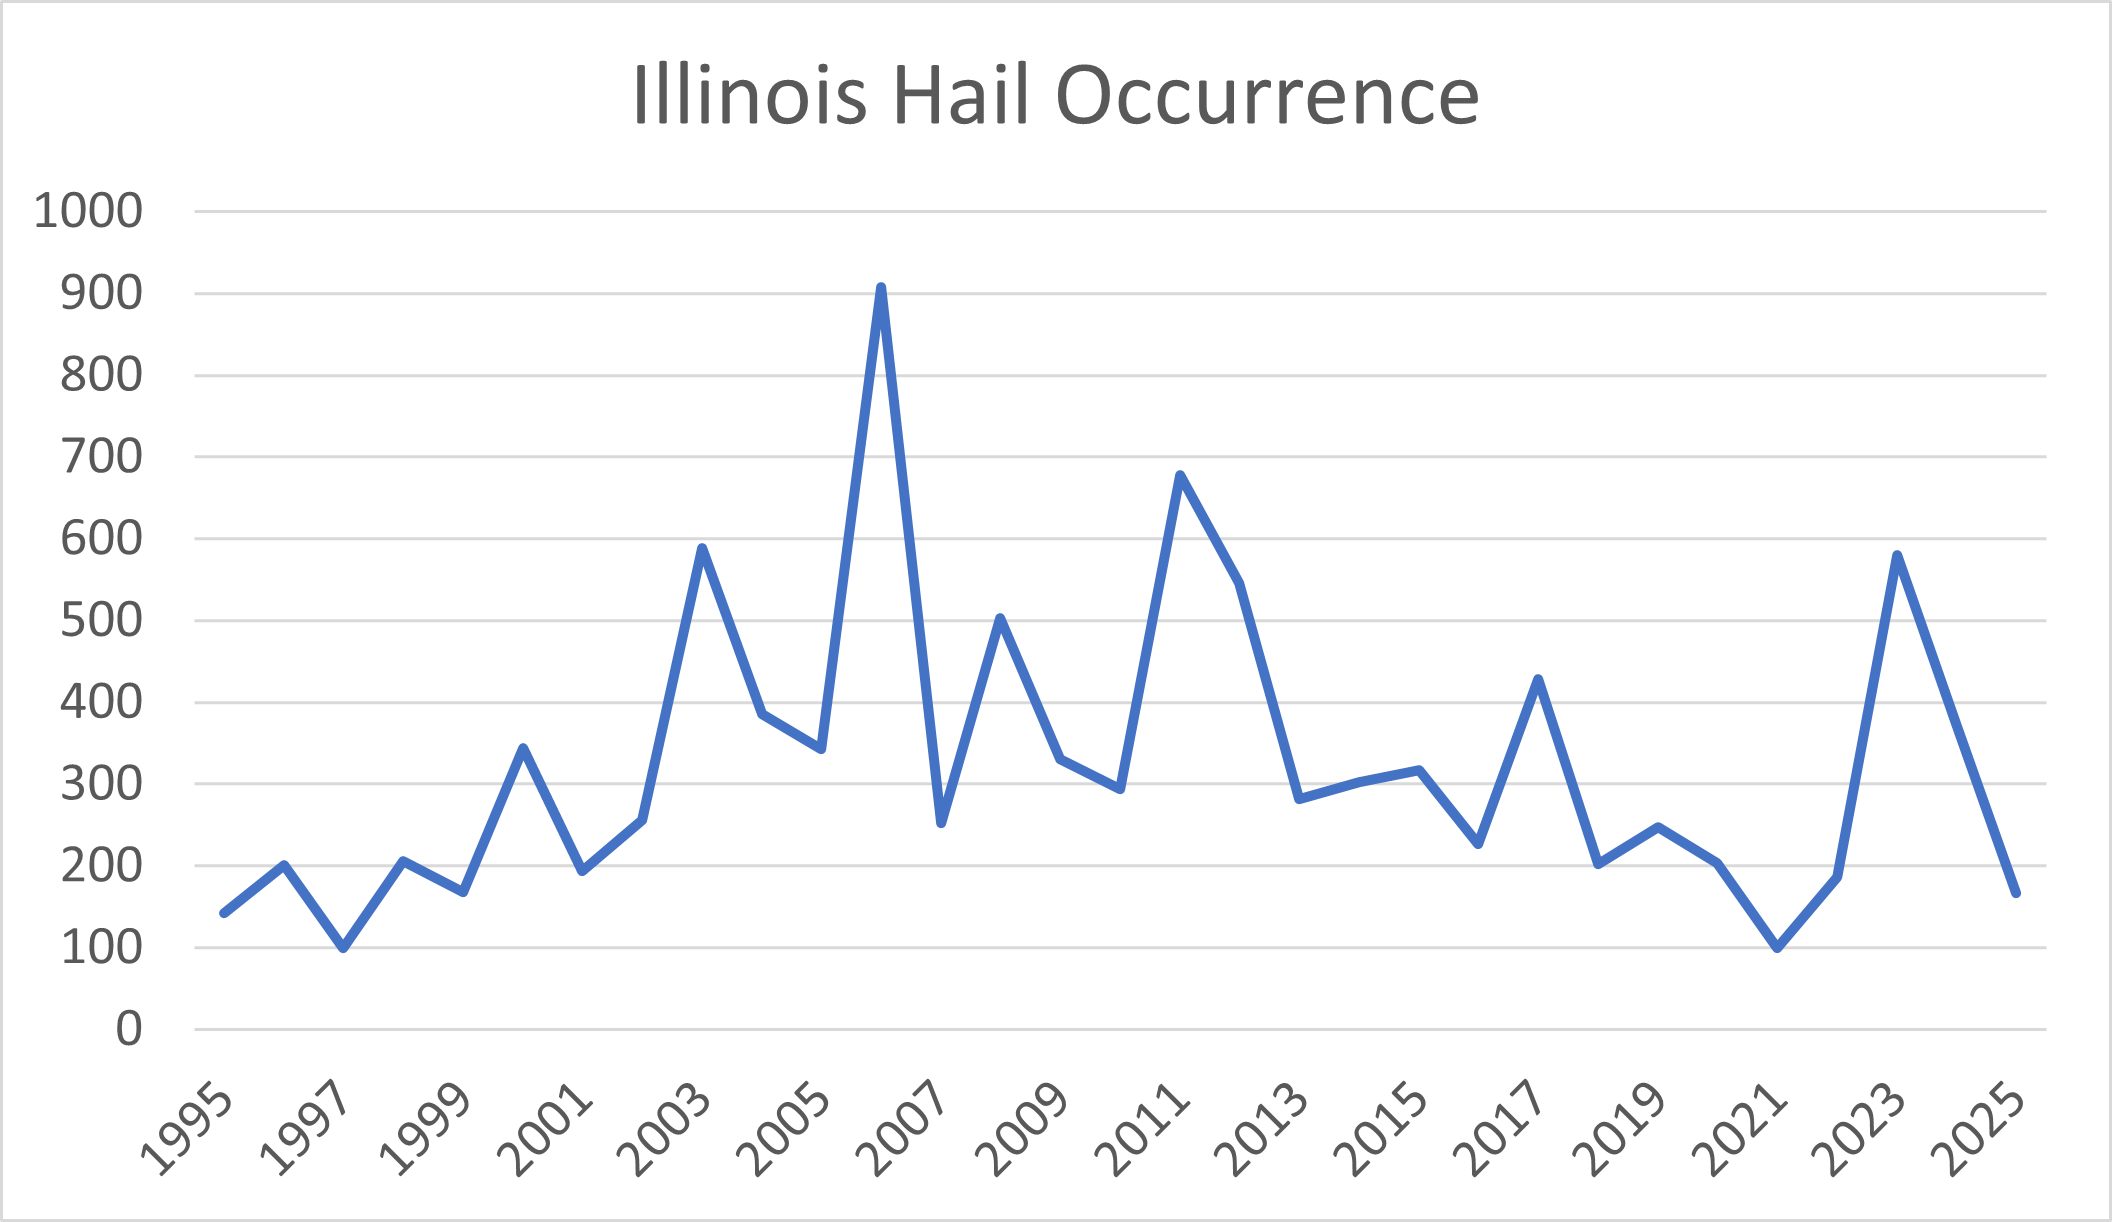
Hail is a major danger to crops, buildings, and cars, and is one of the threats that natural storms bring to the Midwest. Data show it has not become more common in Illinois.10
Figure 3: Illinois hail reports, from 1995 to 2025, data from NWS Storm Prediction Center.
Lake Water Levels
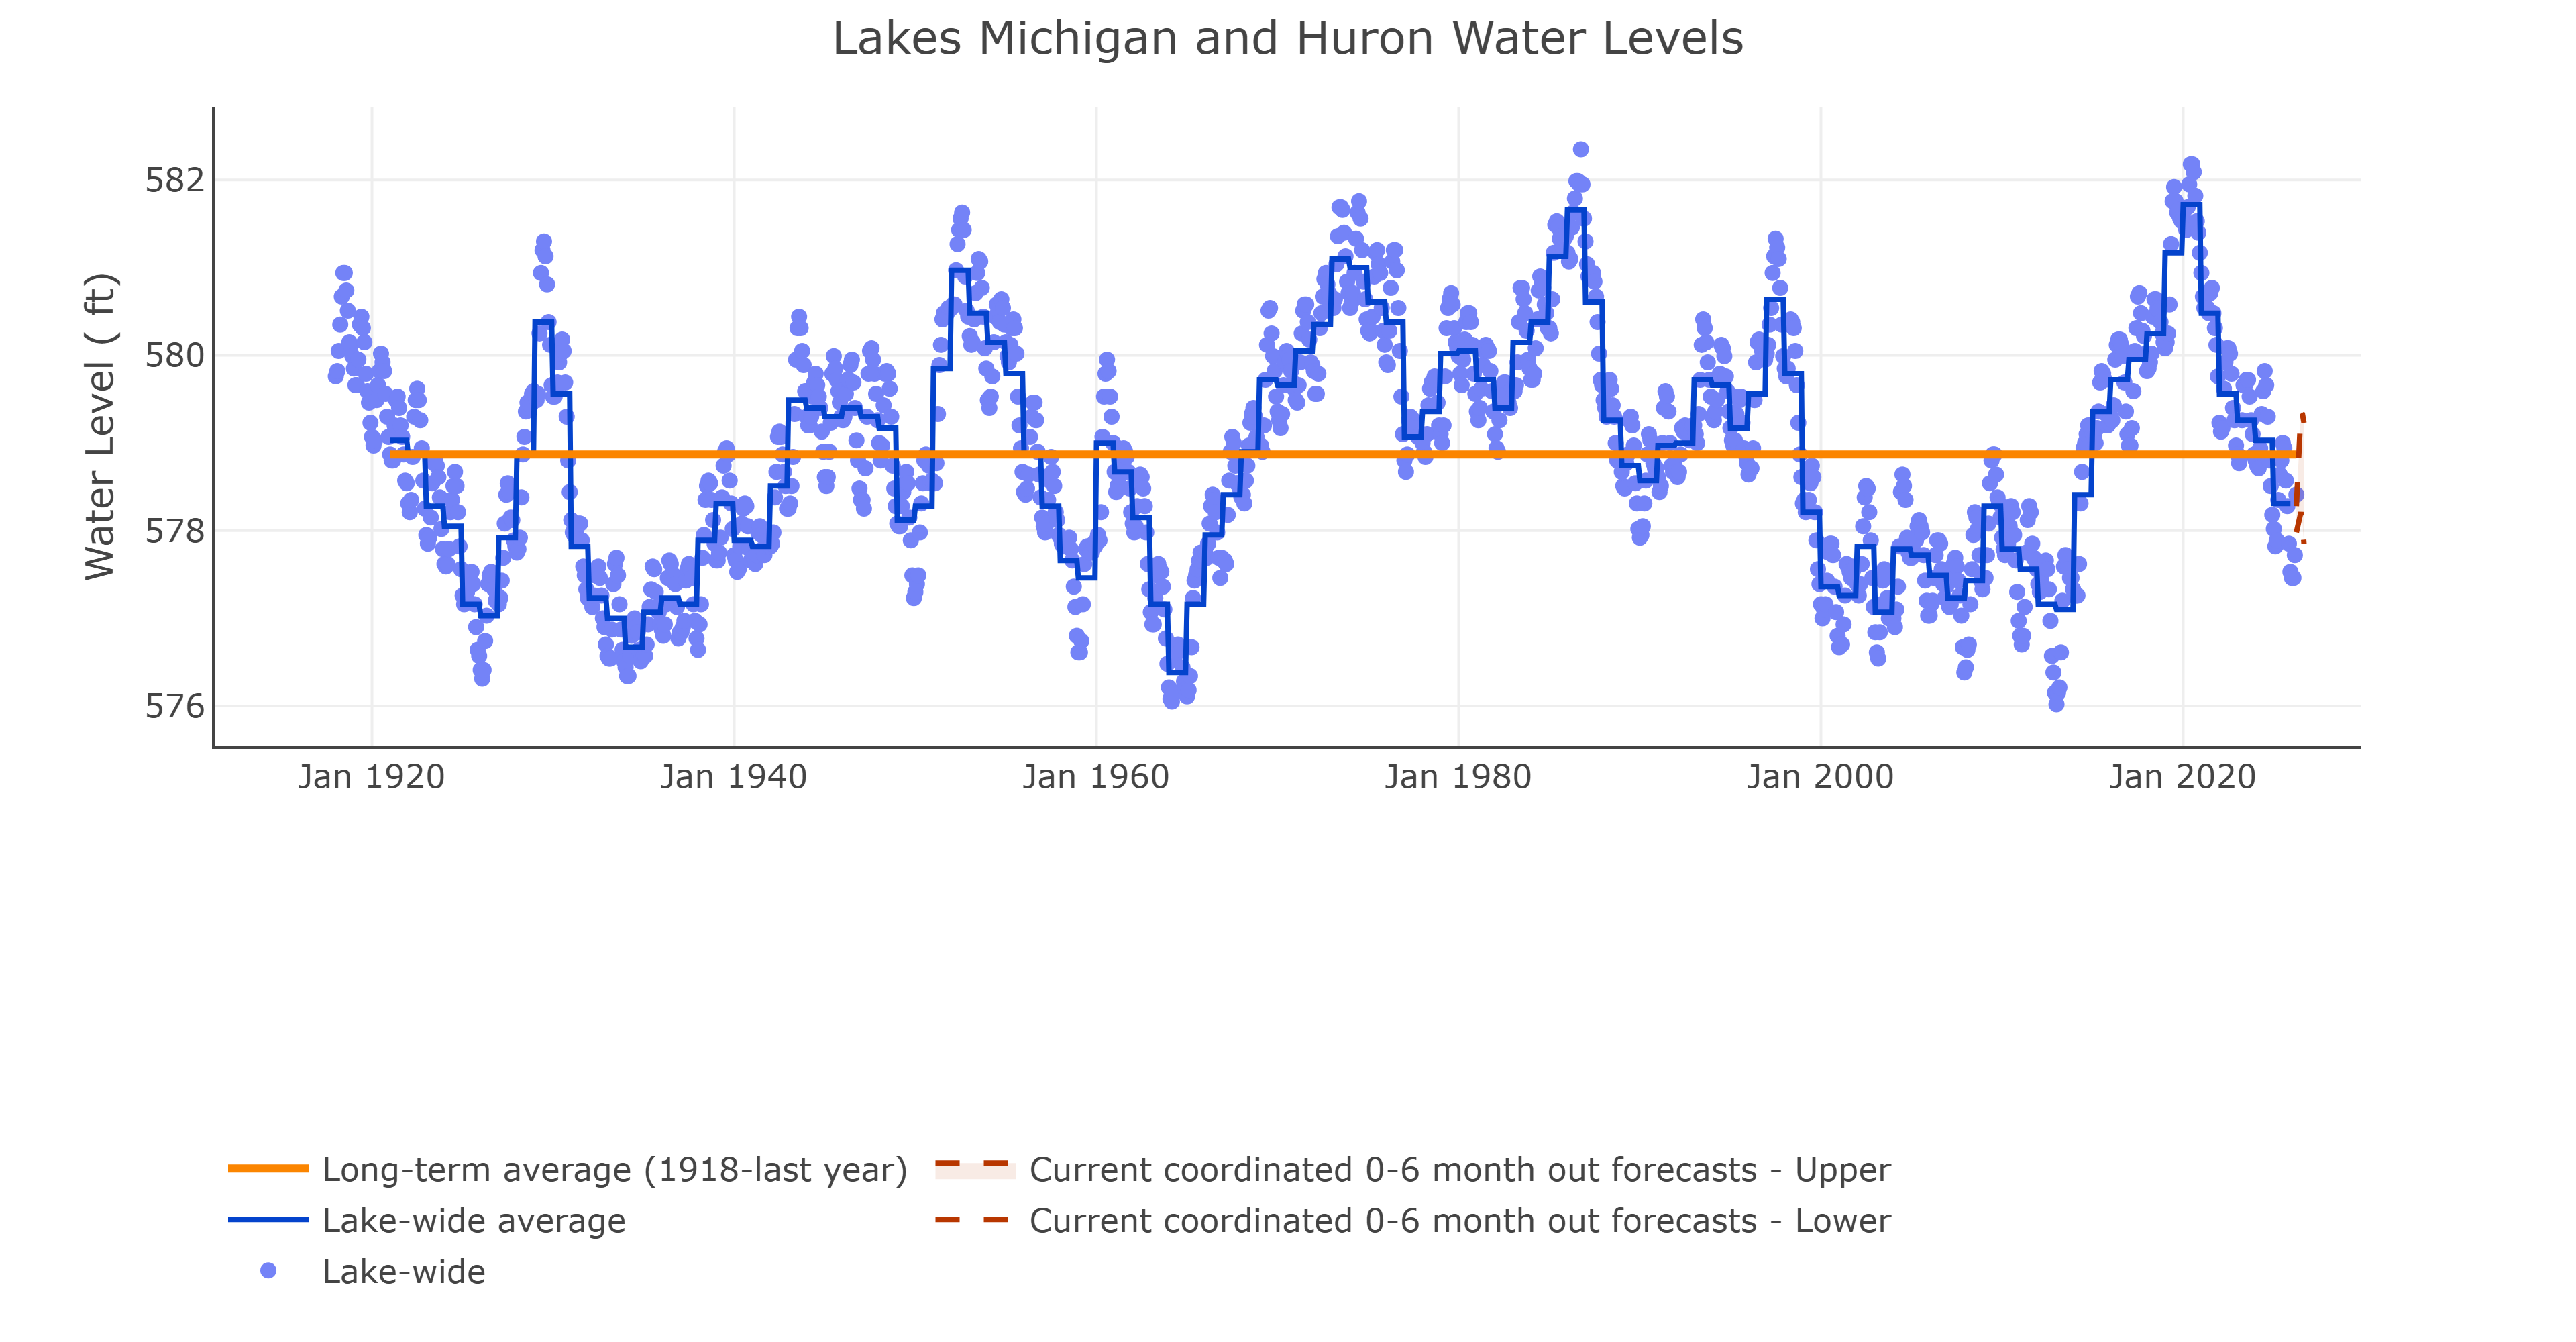
Lake Michigan is very important to Illinois as a water source, and there has been some concern about the impact of climate change on lake levels. Data show that water levels have always fluctuated over time, and there is no long-term trend towards a “drying out” of Lake Michigan.11
Figure 4: Lake Michigan and Huron Water levels, 1918-2026, chart from NOAA Great Lakes Environmental Research Laboratory.
Agriculture:
Illinois agriculture is dominated by corn and soybeans. The Prairie State leads the country in soybean production and is second only to Iowa in corn production.
Since 1900, Illinois corn production has skyrocketed 462 percent, with yields of the staple crop increasing from 40 bushels-per-acre to 214—a 434 percent increase over the same period.12
Data only goes back to 1924 for Illinois soybean production, but production today is nearly 500 times what it was in 1924, with the most dramatic spike occurring in the past two decades. Yields increased about 420 percent over the same period.13
Conclusion:
Illinois is not suffering from any increase in extreme heat, nor is it seeing a worsening of the kinds of severe weather the state is prone to, like tornadoes and hailstorms. There has been a gradual increase in precipitation, which benefits the expansive agricultural industry and has aided in production and yield increases in staple crops like corn and soybeans.
Roy W. Spencer, John R. Christy, and William D. Braswell, “Urban Heat Island Effects in U.S. Summer Surface Temperature Data, 1895–2023,” Journal of Applied Meteorology and Climatology, https://doi.org/10.1175/JAMC-D-23-0199.1
The number of days and nights with extreme heat have both declined in Illinois since the 1930s.
Average warming is driven by warmer low temperatures influenced by the urban heat island effect.
Since 1900, average precipitation has increased gradually, with drought becoming less severe.
There has been no trend for either tornadoes or extreme hail.
Agricultural staples like corn and soybeans have increased massively over the past century, with soybean production 500 times higher today.
Short Summary:
Temperature Trends:
Illinois is dominated by a humid continental climate according to Köppen classification, which means that winters tend to be below freezing and summers are hot, with plenty of precipitation year-round.1
Average temperatures have risen approximately 1.5°F in Illinois since 1900; however, this is not driven by hotter days. The number of “very hot” (95°F or higher) days and “very warm” (75°F or higher) nights have both significantly declined since peaks in the 1930s.2 The warming trend is driven mainly by a decline in the number of very cold (0°F and below) nights, especially in winter months. This is not a bad thing for public health: extremely cold temperatures kill far more people than extremely hot temperatures.3 Shorter winters and longer growing seasons also improve conditions for crops and native plants.
Recent research strongly suggests that much of the nighttime warming in Illinois since 1900 is likely due to the urban heat island effect, driven by increasing urbanization and population density.4
Figure 1: Annual number of “days with a maximum temperature of 95°F or higher. Orange bars show averages over five-year period, with the last bar a six-year average. Dots are yearly values, and the horizontal line shows the long-term average. Chart from Frankson, R., K.E. Kunkel, S.M. Champion, et al, 2022: Illinois State Climate Summary 2022.
Precipitation:
Annual precipitation has gradually increased in Illinois since 1900,5 and there has been an increase in what are called days with “2-inch extreme precipitation events,” but only from an average of approximately 1.5 days per year to less than 2.5 days per year.6
Drought has become less severe in recent decades, with the worst historical droughts having occurred in the 1930s-1950s.7
State-Specific Issues:
Tornadoes
Tornadoes are common in Illinois, especially in the spring and summer. Total tornadoes since the advent of improved observation coverage and Doppler radar show no trend of tornadoes becoming more frequent or severe.8 There is no trend whatsoever in the number of strong (EF2+) tornadoes over the past three decades.9
Figure 2: Strong (EF2+) tornadoes in Illinois from 1995-2025. Data from NWS Storm Prediction Center.
Hail
Hail is a major danger to crops, buildings, and cars, and is one of the threats that natural storms bring to the Midwest. Data show it has not become more common in Illinois.10
Figure 3: Illinois hail reports, from 1995 to 2025, data from NWS Storm Prediction Center.
Lake Water Levels
Lake Michigan is very important to Illinois as a water source, and there has been some concern about the impact of climate change on lake levels. Data show that water levels have always fluctuated over time, and there is no long-term trend towards a “drying out” of Lake Michigan.11
Figure 4: Lake Michigan and Huron Water levels, 1918-2026, chart from NOAA Great Lakes Environmental Research Laboratory.
Agriculture:
Illinois agriculture is dominated by corn and soybeans. The Prairie State leads the country in soybean production and is second only to Iowa in corn production.
Since 1900, Illinois corn production has skyrocketed 462 percent, with yields of the staple crop increasing from 40 bushels-per-acre to 214—a 434 percent increase over the same period.12
Data only goes back to 1924 for Illinois soybean production, but production today is nearly 500 times what it was in 1924, with the most dramatic spike occurring in the past two decades. Yields increased about 420 percent over the same period.13
Conclusion:
Illinois is not suffering from any increase in extreme heat, nor is it seeing a worsening of the kinds of severe weather the state is prone to, like tornadoes and hailstorms. There has been a gradual increase in precipitation, which benefits the expansive agricultural industry and has aided in production and yield increases in staple crops like corn and soybeans.
Roy W. Spencer, John R. Christy, and William D. Braswell, “Urban Heat Island Effects in U.S. Summer Surface Temperature Data, 1895–2023,” Journal of Applied Meteorology and Climatology, https://doi.org/10.1175/JAMC-D-23-0199.1
We use cookies to ensure that we give you the best experience on our website. If you continue to use this site we will assume that you are happy with it.