Nebraska has experienced a dramatic decline in the number of extremely hot days.
Average temperatures have increased by about 1.6°F, largely because of beneficially milder winters.
Precipitation has improved, and drought shows no trend toward worsening.
Neither severe tornadoes nor hail have become more common.
Yields, especially for staple crops like corn, have skyrocketed in recent decades.
Short Summary:
Temperature Trends
Nebraska is a Great Plains state, dominated by moderately hot summers and cold winters. There is little difference in precipitation between seasons, although the panhandle to the West is cooler and more arid on average than the rest of the state.1
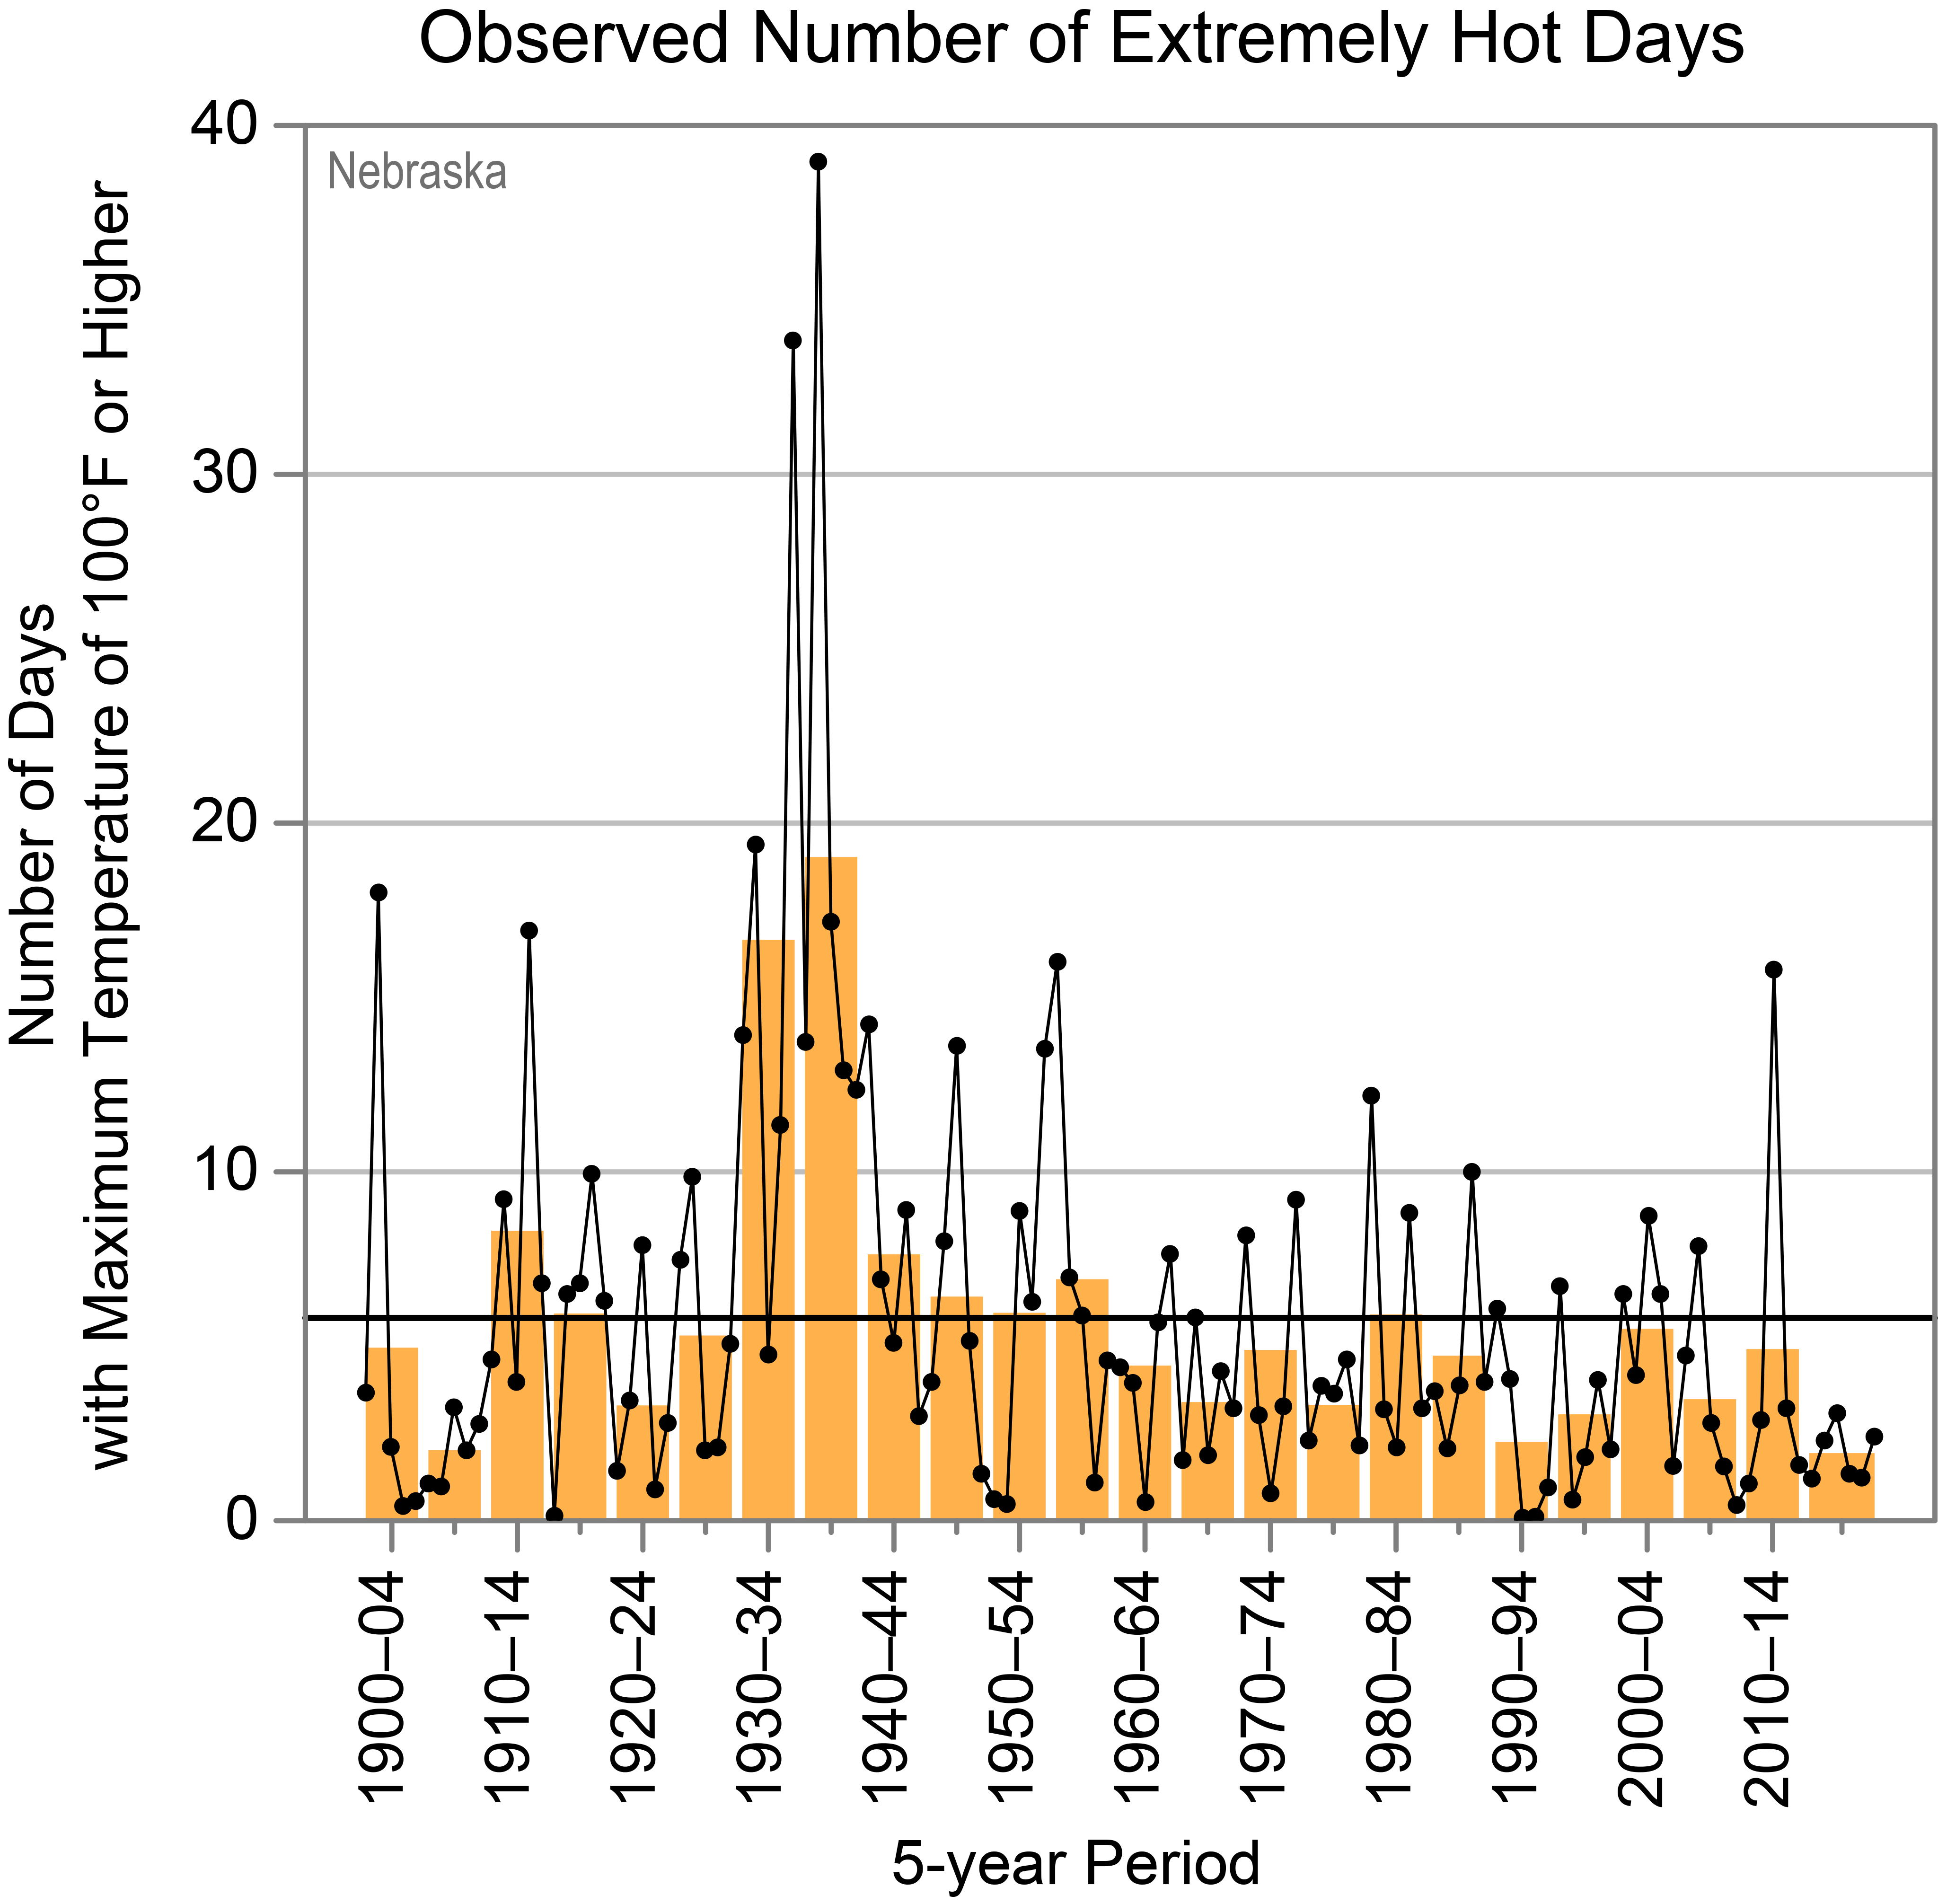
Average temperatures in Nebraska have warmed by 1.6°F. That slight warming is not a result of more extreme summertime heat, warmer nights, or any increase in “extremely hot” days (maximum temperatures of 100°F or higher).2 In fact, the number of extremely hot days has consistently declined since peaks in the 1930s. (See Figure 1, below)
Figure 1: Observed number of very hot days in Nebraska since 1900. Dots are annual values. Orange bars show averages over a 5-year period, the last bar is a 6-year average. The horizontal black line shows the average of the entire period. Chart Source: Frankson, R., et al. Nebraska State Climate Summary 2022.
Data show a very gradual warming of average winter temperatures, and a decline in the number of nights with temperatures 0°F and below accounts for the slight average warming.3 Milder winters while summers remain steady is a good thing for Nebraskans; research shows that cold temperatures are 10 times deadlier than hot weather.4
Precipitation
Since hitting a low point in the 1930s, annual precipitation has gradually recovered in Nebraska. Although there has been a slight increase in 2-inch “extreme” precipitation events in recent years, that increase remains below levels experienced in the early 1900s.5
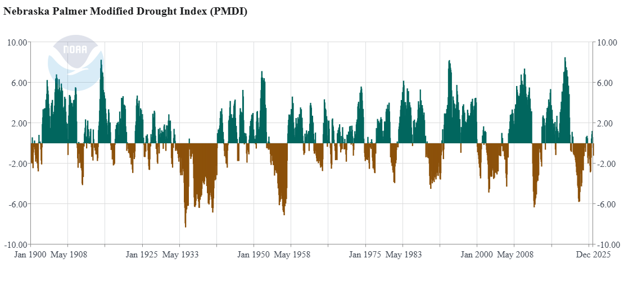
Severe drought has occurred periodically throughout Nebraska’s history. There is no long-term trend in more frequent or severe drought.6 The most severe droughts on record for the state occurred in the 1930s and 1950s. (See Figure 2, below)
Figure 2: Palmer Modified Drought Index for Nebraska, 1900-2025. Positive values (green) represent wetter-than-average conditions, negative (brown) represent drier-than-average. Chart from NOAA National Centers for Environmental information.
State-Specific Issues
As a plains state, Nebraska is prone to severe thunderstorms, which on occasion bring with them tornadoes and hailstorms.
Tornadoes
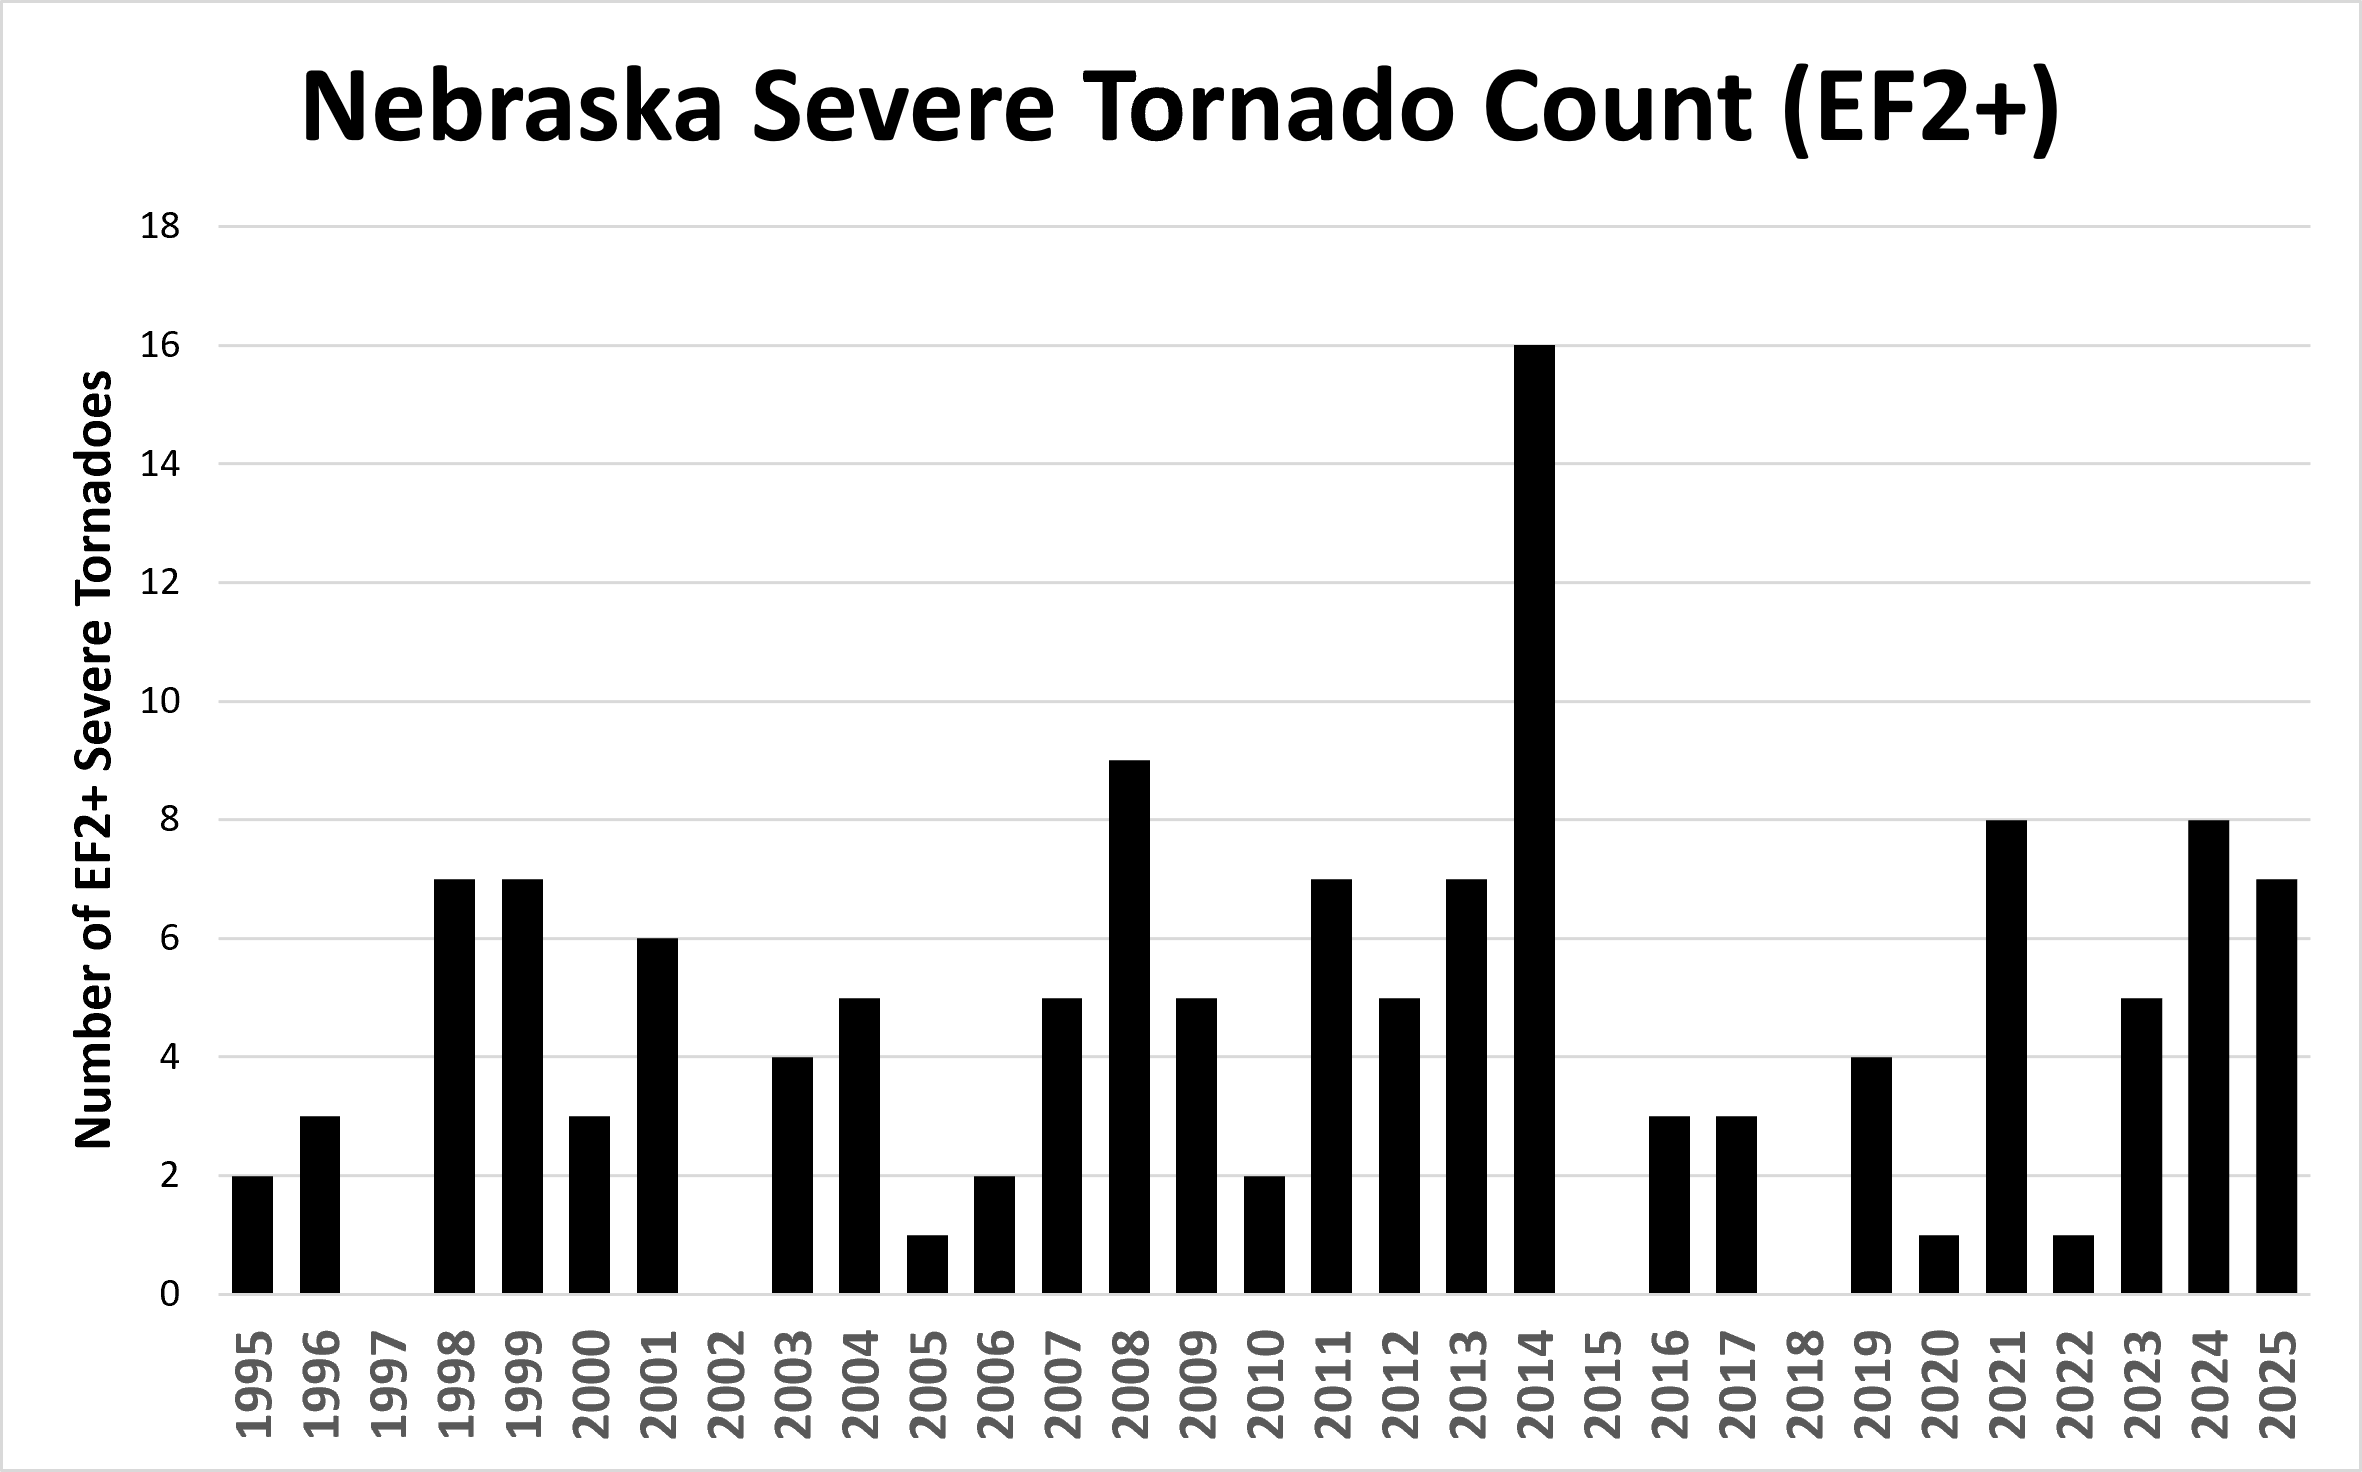
Tornado data for EF2 and above tornadoes in Nebraska show no particular trend since the widespread adoption of improved radar and observation coverage.7 (See Figure 3, below)
Figure 3: (EF2+) tornadoes in Nebraska from 1995-2025. Data from NWS Storm Prediction Center.
Hail
Hail can be dangerous to life and damage property like cars and roofs. Nebraska hail data show a gradual increase from the 1990s to the mid-2010s, with a general decline since then. Historical records show that hail occurrences vary widely from one year to the next.8
Agriculture
Nebraska is dominated by corn production, followed by soybeans and hay. All these crops have experienced substantial gains in yields and production during the recent period of modest warming.
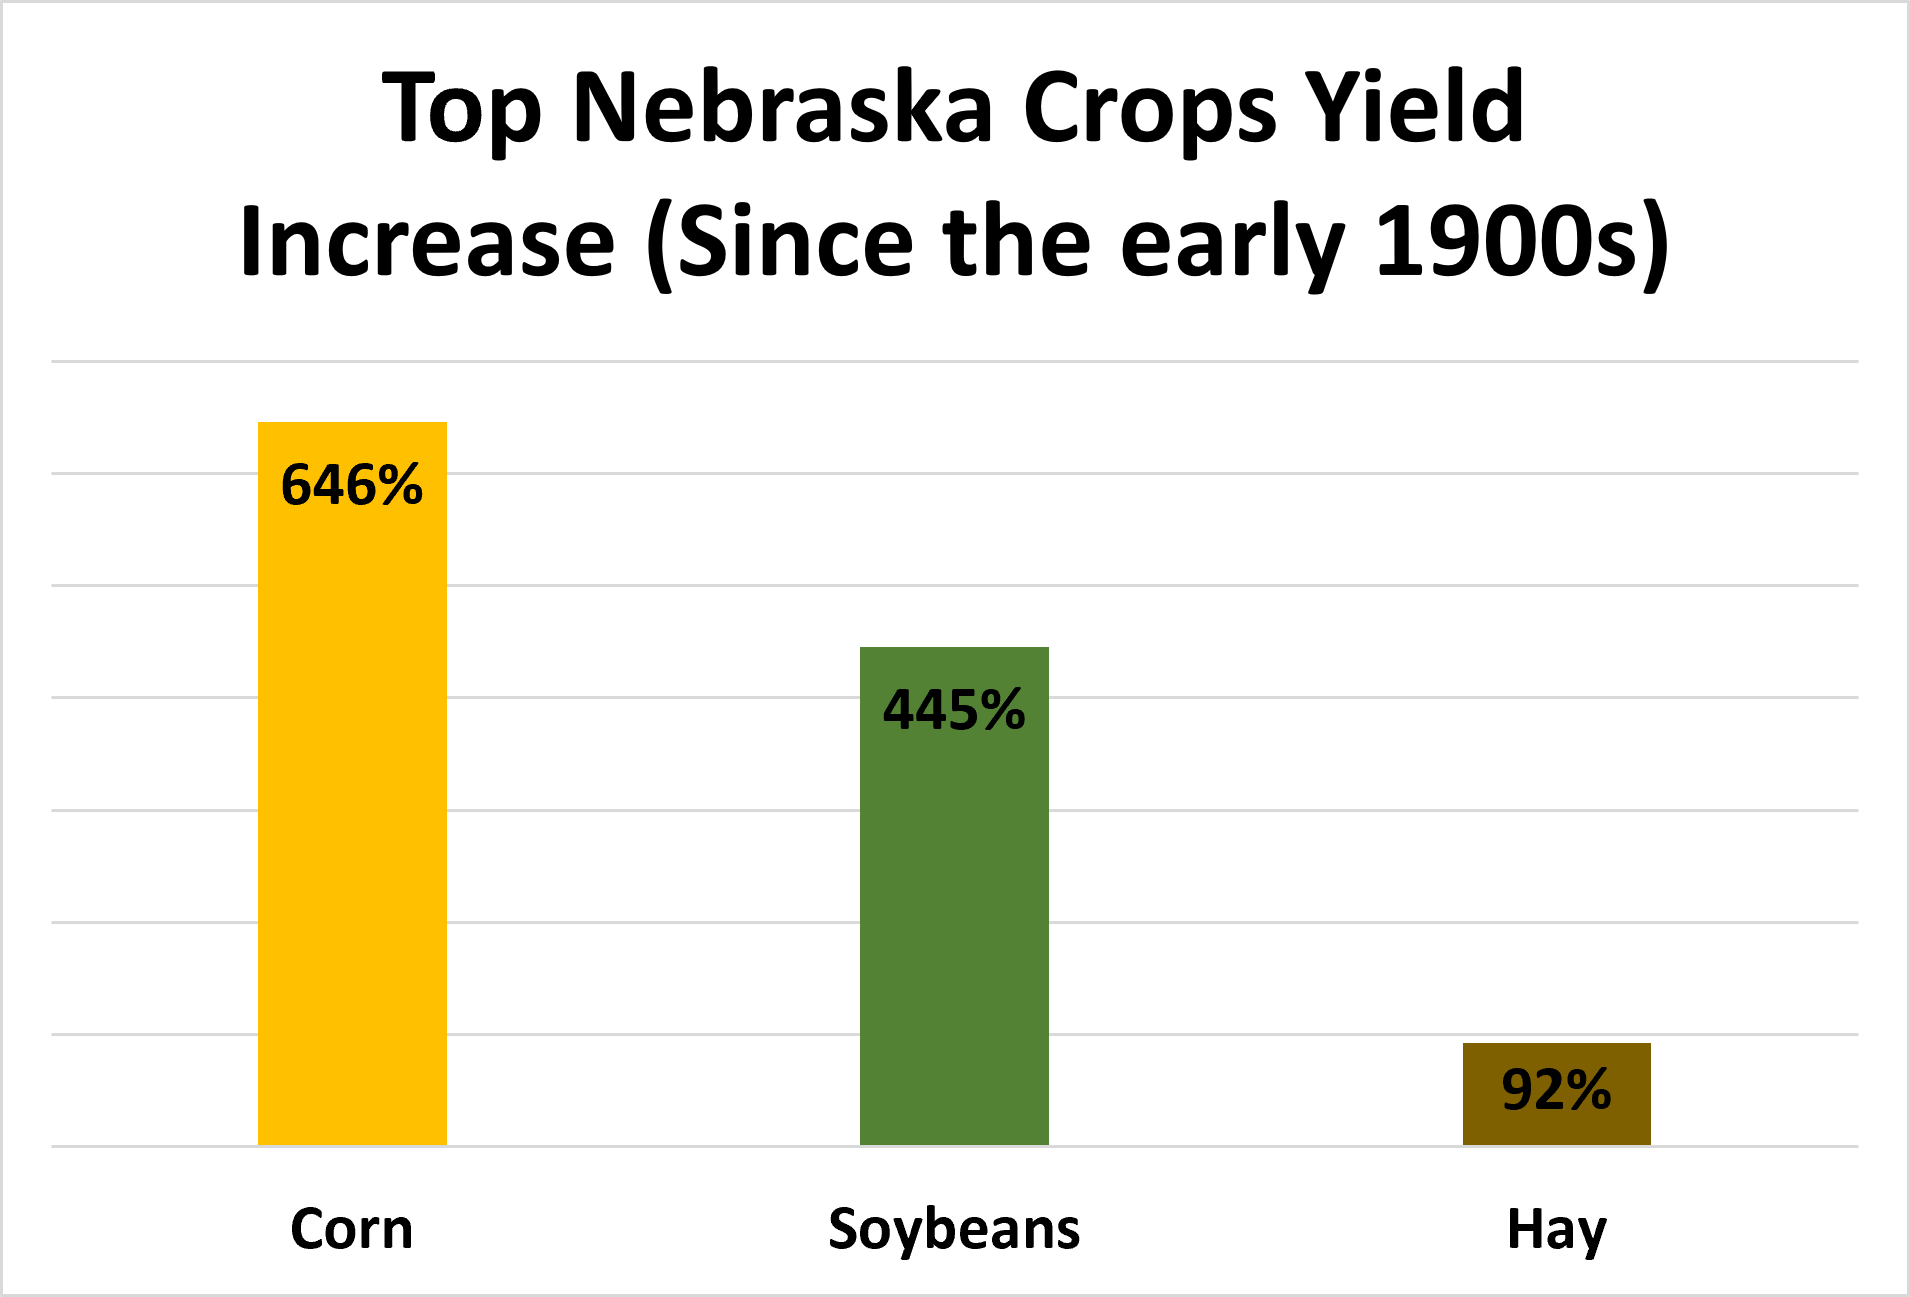
Thanks to improved agricultural technology, as well as improved precipitation and carbon dioxide fertilization, Nebraska corn yields have skyrocketed 646 percent since 1900.9 Corn production hit an all-time high in 2025.
Since 1938, Nebraska soybean yields have increased 445 percent, with the highest-ever production record set in 2021.10
Hay, which is important for feeding livestock, has experienced increased yields as well. Specifically, hay yields have increased by 92 percent since 1909, despite fewer acres being devoted to hay production since a high in the 1980s.11
Figure 4: Corn, Soybeans, and hay yield increases since the early 1900s. Data from USDA National Agricultural Statistics Service.
Conclusion
Milder winters and fewer extreme highs mean Nebraska is experiencing a moderating climate, not one facing greater extremes. Tornadoes and severe hail have not worsened, and improved precipitation has been a boon for crop yields, which have dramatically increased for all of Nebraska’s major crops.
Nebraska has experienced a dramatic decline in the number of extremely hot days.
Average temperatures have increased by about 1.6°F, largely because of beneficially milder winters.
Precipitation has improved, and drought shows no trend toward worsening.
Neither severe tornadoes nor hail have become more common.
Yields, especially for staple crops like corn, have skyrocketed in recent decades.
Short Summary:
Temperature Trends
Nebraska is a Great Plains state, dominated by moderately hot summers and cold winters. There is little difference in precipitation between seasons, although the panhandle to the West is cooler and more arid on average than the rest of the state.1
Average temperatures in Nebraska have warmed by 1.6°F. That slight warming is not a result of more extreme summertime heat, warmer nights, or any increase in “extremely hot” days (maximum temperatures of 100°F or higher).2 In fact, the number of extremely hot days has consistently declined since peaks in the 1930s. (See Figure 1, below)
Figure 1: Observed number of very hot days in Nebraska since 1900. Dots are annual values. Orange bars show averages over a 5-year period, the last bar is a 6-year average. The horizontal black line shows the average of the entire period. Chart Source: Frankson, R., et al. Nebraska State Climate Summary 2022.
Data show a very gradual warming of average winter temperatures, and a decline in the number of nights with temperatures 0°F and below accounts for the slight average warming.3 Milder winters while summers remain steady is a good thing for Nebraskans; research shows that cold temperatures are 10 times deadlier than hot weather.4
Precipitation
Since hitting a low point in the 1930s, annual precipitation has gradually recovered in Nebraska. Although there has been a slight increase in 2-inch “extreme” precipitation events in recent years, that increase remains below levels experienced in the early 1900s.5
Severe drought has occurred periodically throughout Nebraska’s history. There is no long-term trend in more frequent or severe drought.6 The most severe droughts on record for the state occurred in the 1930s and 1950s. (See Figure 2, below)
Figure 2: Palmer Modified Drought Index for Nebraska, 1900-2025. Positive values (green) represent wetter-than-average conditions, negative (brown) represent drier-than-average. Chart from NOAA National Centers for Environmental information.
State-Specific Issues
As a plains state, Nebraska is prone to severe thunderstorms, which on occasion bring with them tornadoes and hailstorms.
Tornadoes
Tornado data for EF2 and above tornadoes in Nebraska show no particular trend since the widespread adoption of improved radar and observation coverage.7 (See Figure 3, below)
Figure 3: (EF2+) tornadoes in Nebraska from 1995-2025. Data from NWS Storm Prediction Center.
Hail
Hail can be dangerous to life and damage property like cars and roofs. Nebraska hail data show a gradual increase from the 1990s to the mid-2010s, with a general decline since then. Historical records show that hail occurrences vary widely from one year to the next.8
Agriculture
Nebraska is dominated by corn production, followed by soybeans and hay. All these crops have experienced substantial gains in yields and production during the recent period of modest warming.
Thanks to improved agricultural technology, as well as improved precipitation and carbon dioxide fertilization, Nebraska corn yields have skyrocketed 646 percent since 1900.9 Corn production hit an all-time high in 2025.
Since 1938, Nebraska soybean yields have increased 445 percent, with the highest-ever production record set in 2021.10
Hay, which is important for feeding livestock, has experienced increased yields as well. Specifically, hay yields have increased by 92 percent since 1909, despite fewer acres being devoted to hay production since a high in the 1980s.11
Figure 4: Corn, Soybeans, and hay yield increases since the early 1900s. Data from USDA National Agricultural Statistics Service.
Conclusion
Milder winters and fewer extreme highs mean Nebraska is experiencing a moderating climate, not one facing greater extremes. Tornadoes and severe hail have not worsened, and improved precipitation has been a boon for crop yields, which have dramatically increased for all of Nebraska’s major crops.
We use cookies to ensure that we give you the best experience on our website. If you continue to use this site we will assume that you are happy with it.